거래기술에 관한 정보
Wolfe Wave Patterns울프 웨이브 패턴
효성공인
2023. 8. 4. 14:30
Wolfe Wave Patterns
울프 웨이브 패턴
By Steve Burns
The Wolfe Wave chart pattern is created when price action makes 5 waves showing the key supply and demand areas that create a zone of support and resistance as buyers and sellers fight back and forth until a breakout of the expanding range occurs to a projected price extension.
Wolfe Wave 차트 패턴은 가격 조치가 추정된 가격 확장에 대한 확장 범위로 돌파가 발생할 때까지 구매자와 판매자가 앞뒤로 싸울 때 지원 및 저항 영역을 생성하는 주요 공급 및 수요 영역을 보여주는 5개의 물결을 만들 때 생성됩니다.
Wolfe Wave patterns can be created on any timeframe and they are used for two things:
Wolfe Wave 패턴은 모든 시간대에 생성할 수 있으며 두 가지 용도로 사용됩니다.
1)Project the probability of the path of least resistance for the next price swing.
다음 가격 변동에 대한 저항이 가장 적은 경로의 확률을 예상합니다.
2)Create an entry signal for increasing the odds of being in a position when it moves in one direction.
한 방향으로 이동할 때 위치에 존재할 확률을 높이기 위해 진입 신호를 만듭니다.
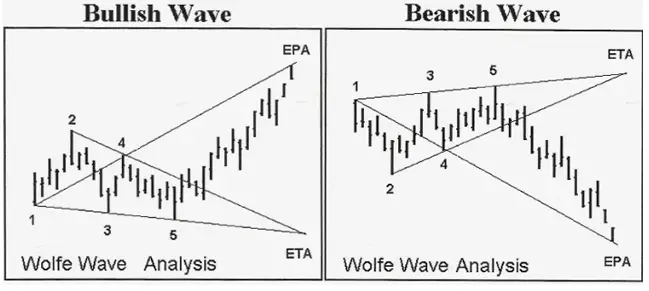
Wolfe wave patterns can be either bullish or bearish depending on the direction of the breakout of resistance or support.
울프 웨이브 패턴은 저항 또는 지원의 돌파 방향에 따라 강세 또는 약세일 수 있습니다.

Bullish and Bearish Wolfe Wave Example (Image Source:www.insidefutures.com)
These chart patterns create breakout signals and are meant to capture trends in price in the direction of the breakout.
이러한 차트 패턴은 브레이크 아웃 신호를 생성하고 브레이크 아웃 방향으로 가격 추세를 포착하기 위한 것입니다.
Price channels in an uptrend can create a Bearish Wolfe wave and price channels in a downtrend can create a bullish Wolfe Wave and a sideways range happens when price is moving sideways and it can be neutral and break in either direction.
상승 추세의 가격 채널은 Bearish Wolfe 파동을 생성할 수 있고 하락 추세의 가격 채널은 Bullish Wolfe Wave를 생성할 수 있으며 가격이 옆으로 움직일 때 횡보 범위가 발생하고 중립적이며 어느 방향으로든 중단될 수 있습니다.
The bullish Wolfe Wave is a type of the falling wedge chart pattern. The bearish Wolfe wave is a type of the rising wedge chart pattern. It is where the breakout of the support or resistance happens that determines the sentiment. The Wolf Wave is similar to an Elliott Wave as it attempts to project the magnitude of the move of a wave.
황소 Wolfe Wave는 떨어지는 웨지 차트 패턴의 한 유형입니다. 곰 같은 울프 웨이브는 상승 웨지 차트 패턴의 한 유형입니다. 그것은 정서를 결정하는 지지 또는 저항의 돌파가 발생하는 곳입니다. Wolf Wave는 Elliott Wave와 유사하며 파동 이동의 크기를 투영하려고 시도합니다.
For a chart pattern to qualify as a Wolfe Wave pattern it must have the following dynamics in price action:
차트 패턴이 Wolfe Wave 패턴으로 인정되려면 가격 행동에 다음과 같은 역학이 있어야 합니다.
1) The 3 and 4 waves must remain inside the channel made by the 1 and 2 waves.
3파와 4파는 1파와 2파가 만든 채널 안에 남아 있어야 합니다.