Candlestick Patterns: The Definitive Guide(촛대 패턴: 확실한 가이드)
BySteve Burns
A candlestick is a type of chart used in trading as a visual representation of past and current price action in specified timeframes.
촛대는 특정 기간 동안 과거 및 현재 가격 움직임을 시각적으로 나타내기 위해 거래에 사용되는 차트 유형입니다.
A candlestick consists of the body with an upper or lower wick or shadow when price trades outside the open and closing prices.
촛대는 가격이 시가와 종가를 벗어나 거래될 때 위 또는 아래 심지 또는 그림자가 있는 몸체로 구성됩니다
Most candlestick charts are colored showing a higher close than the open as represented by either a green or white candle with the opening price as the bottom of the candle and the closing price as the high of the candle. Also, most candlestick charts show a lower close than the open represented by either a red or black candle with the opening price as the top of the candle body and the closing price as the low of the candle body.
대부분의 촛대는 촛대의 상단으로서 종가와 촛대의 하단으로서 개싯가를 가진 녹색 또는 흰색으로 나타냄에 따라 개시보다는 높은 종가를 보이는 것으로 색칠된다(상승세) 또한 대부분 촛대 차트는 촛대의 몸체의 하단으로서 종가와 촛대 몸체상단으로서 시작가를 가진 적색 또는 흑색에 의하여 나타내는 시작가 보다 낮은 종가를 나타낸다 (하락세)
Price action that happens outside the opening and closing prices of the period are represented by the wicks or shadows above or below the body of each candle. Upper wicks represent price action that occurred above the open and the closing prices and the lower wicks represent price action that occurred below the opening and closing prices.
기간의 개폐 가격 외부에서 발생하는 가격 행동은 각 양초의 몸체 위 또는 아래의 심지 또는 그림자로 표시됩니다. 상단 심지는 개방 및 종가보다 높은 가격 행동을 나타내며 하단 심지는 개방 및 종가보다 낮은 가격 행동을 나타냅니다.
Candlesticks are one type of chart that can be used in technical analysis to look for repeating patterns and in correlation with other technical indicators and signals.
촛대는 반복하는 패턴을 찾는 기술적 분석에서와 다른 기술적 표시기와 신호의 상호작용에서 사용되어질 수 있는 차트의 한 형태이다
Candlesticks are combined with chart patterns, support and resistance levels, and technical signals to try to read the behavior of traders and investors in buying and selling to create good risk/reward setups for trading.
촛대는 차트패턴,지원 저항의 수준과 기술신호와 결합되어 거래를 위한 좋은 위험 보상비율을 만들기 위한 매수를 하고 매도를 하는데 있어서 거래자와 투자자들의 행동을 읽으려고 노력한다
Candlestick charts have different settings. Candlesticks can be set to be green/red or they can be set as hollow candles. With the green/red settings the green candles occur when price closes higher than the previous close and red candles occur if price closes lower than the previous close.
촛대 차트의 설정이 다릅니다. 촛대는 녹색 / 빨간색으로 설정하거나 속이 빈 양초로 설정할 수 있습니다. 녹색 / 빨간색 설정을 사용하면 가격이 이전 종가보다 높게 닫히면 녹색 양초가 발생하고 가격이 이전 종가보다 낮게 닫히면 빨간색 양초가 발생합니다.

Hollow candlesticks are made up of four components in two groups. First, a close lower than the prior close gets a red candlestick and a higher close than the previous close gets a white candlestick. Second, a candlestick is hollow when the close is above the open and filled when the close is below the open. The following image shows the four possible hollow and filled candle combinations when using hollow candlestick chart settings.
속이빈 촛대는 두 그룹으로 구성된 네 가지 구성 요소로 구성됩니다(종가와 시작가: ).
첫째, 이전 종료보다 낮은 종료(하락)는 빨간색 촛대를 얻고 이전 닫힘보다 높은 닫힘(상승)은 흰색 촛대를 얻습니다.
둘째, 촛대는 닫힘이 개시 위에 있을 때는 속이 비어 있고 닫힘이 개시 밑에 있을 때는 채워집니다. 다음 이미지는 속이 빈 촛대 차트 설정을 사용할 때 가능한 네 가지 속이 빈 캔들 및 채워진 캔들 조합을 보여줍니다.

Red-hollow candlesticks can show some bullish reversal price action on an overall bearish chart. Even as the closing price was lower than the previous close making the candle red the price action moved higher during the period after the open making it hollow. Even though it closed lower than the previous trading period, there was buying pressure near the lows that made it close higher than the open.
붉은색 속이빈 촛대는 전반적인 하락세의 차트에서 약간의 상승세의 반전 가격의 움직임을 보여 줄 수 있다 종가가 이전의 종가보다 낮음에도 불구하고 가격을 적색으로 하면 가격의 움직임은 개시 이후에 기간동안에 높게 움직이어 속이 비게 만든다
The solid black or grey-candle is the inverse price action of the red-hollow candle. Even though the closing price was above the previous close making it black, price action did finish lower than the open to make it a black-filled candle. Even though a black-filled candle closes higher on the current period versus the previous period, it does show selling pressure after the opening price. This candle shows rejection of intraday highs and can be a standalone signal of a bearish reversal during an upswing or uptrend in price action especially near new highs in price.
단색 검정색 또는 회색 양초는 빨간색 속빈 양초의 역 가격 동작입니다. 종가가 이전 종가보다 높아서 검은색이 되었지만, 가격 행동은 시작가보다 낮게 마감되어 검은색으로 속을 채운 양초가 되었습니다. 검정색으로 채워진 양초가 이전 기간에 비해 현재 기간에 더 높게 마감되지만, 시작가 이후에는 매도 압력을 보여줍니다. 이 양초는 장중 고점에 대한 거부를 나타내며 특히 가격의 새로운 고점 근처에서 가격 조치의 상승 또는 상승 추세 동안 약세 반전의 독립형 신호가 될 수 있습니다.
There are four types of hollow candlesticks:
속빈 촛대에는 네 가지 유형이 있습니다
① Hollow candles occur when the price closed higher than it opened.
속이빈 양초는 가격이 시작가보다 높게 종료할 때 발생합니다.
② Filled candles occur when the price closed lower than it opened.
채워진 양초는 가격이 시작가보다 낮게 마감되었을 때 발생합니다.
③ White candles occur when the price closed higher than the prior close.
흰색 양초는 가격이 이전 종가보다 높게 종료할 때 발생합니다.
④ Red candles occur when the price closed lower than the prior close.
빨간색 캔들은 가격이 이전 종가보다 낮게 마감될 때 발생합니다.
Note that white candles have black or grey outlines and will at times also be called hollow black candles or hollow grey candles.
흰색 양초에는 검은색 또는 회색 윤곽선이 있으며 때때로 속이 빈 검은색 양초 또는 속이 빈 회색 양초라고도 합니다.
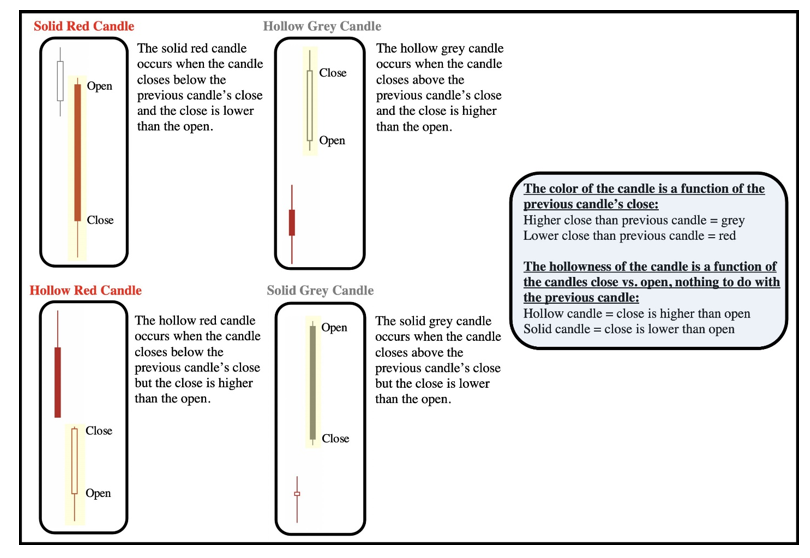
Image courtesy of Jake Wujastyk of TrendSpider.com
TrendSpider.com의 Jake Wujatyk 이미지 제공
Learning to read candlesticks quickly is like learning a type of technical trading language. With time and experience a trader can see what candles are showing about the current price action. A trader can start seeing the patterns that emerge from buyers and sellers shifting the price action around key technical price levels of resistance and support on a chart. Below are bullish, bearish, and neutral candlestick chart patterns and it is important to take the signals that they give in the context of the bigger picture of the chart.
촛대를 빨리 읽는 법을 배우는 것은 일종의 기술 거래 언어를 배우는 것과 같습니다. 시간과 경험을 통해 거래자는 현재 가격 행동에 대해 초가 표시되는 것을 볼 수 있습니다. 거래자는 차트에서 저항 및 지지의 주요 기술적 가격 수준을 중심으로 가격 행동을 이동하는 구매자와 판매자로부터 나타나는 패턴을 볼 수 있습니다. 아래는 강세, 약세 및 중립 촛대 차트 패턴이며 차트의 더 큰 그림의 맥락에서 그들이 주는 신호를 취하는 것이 중요합니다.
Bearish candlestick patterns will have better odds of success when they occur on a chart and have confluence with other bearish signals like overbought readings or a loss of key price support or an important moving average. The same applies with bullish candlestick patterns having better odds of success when they occur on a chart and have confluence with other bullish signals like oversold readings or breaking above a key price support or resistance area or retaking an important moving average.
약세 촛대 패턴은 차트에서 발생하고 과매수 수치 또는 주요 가격 지원 또는 중요한 이동 평균의 손실과 같은 다른 약세 신호와 합류할 때 성공 확률이 더 높습니다. 차트에서 발생하고 과매도 수치 또는 주요 가격 지원 또는 저항 영역을 돌파하거나 중요한 이동 평균을 다시 잡는 것과 같은 다른 강세 신호와 합류할 때 성공 확률이 더 높은 강세 촛대 패턴에도 동일하게 적용됩니다.
Candlestick chart patterns show you the present not the future. They can be used to position traders for good odds of capturing the next direction of price movement by aligning them in the path of least resistance. Profitable trading can emerge from going with the current trend on a chart along with letting your winning trades run and cutting your losing trades short. Along with doing all this with proper position sizing and discipline.
촛대 차트 패턴은 미래가 아닌 현재를 보여줍니다. 그들은 최소 저항의 경로에 정렬하여 가격 움직임의 다음 방향을 포착할 수 있는 좋은 확률에 대해 거래자를 배치하는 데 사용할 수 있습니다. 수익성 있는 거래는 차트의 현재 추세를 따라가는 것과 함께 이기는 거래를 실행하고 잃는 거래를 짧게 줄이는 것에서 나타날 수 있습니다. 적절한 위치 크기 조정 및 훈련으로 이 모든 작업을 수행합니다.
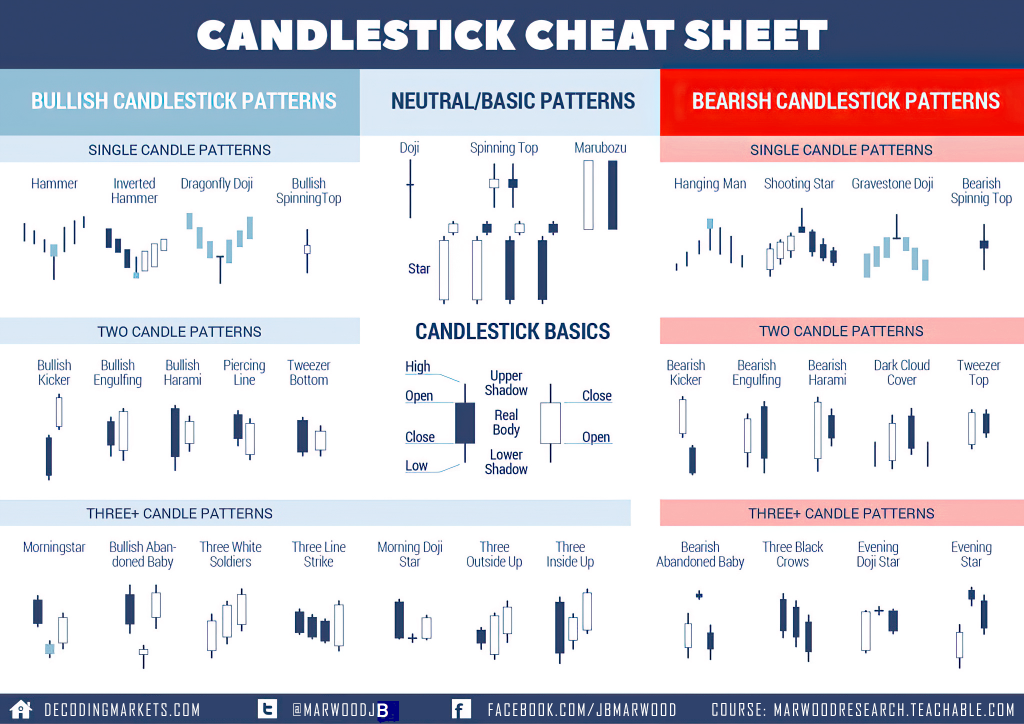
Bullish candlestick patterns on a chart visually show buying pressure. These patterns can show the possibility of a price reversal during a downtrend or the continuation of an uptrend already in place. There can be single bullish candles or bullish candlestick patterns containing multiple candles in row.
차트의 강세 촛대 패턴은 구매 압력을 시각적으로 보여줍니다. 이러한 패턴은 하락세 중 가격 반전 가능성 또는 이미 존재하는 상승세 지속 가능성을 보여줄 수 있습니다. 단일 강세 양초 또는 연속된 여러 양초를 포함하는 강세 양초 패턴이 있을 수 있습니다.
Here are some of the most popular bullish candlestick patterns:
다음은 가장 인기 있는 강세 촛대 패턴 중 일부입니다.
- Hammer(망치)
- Inverted Hammer(거꾸로된 망치)
- Dragonfly Doji(드라곤 도지)
- Bullish Spinning Top(상승 팽이탑)
- Bullish Kicker(상승 키거)
- Bullish Engulfing(상승 인걸핑)
- Bullish Harami(상승하라미)
- Piercing Line(쇄기라인)
- Tweezer Bottom(쪽집게 바닥)
- Morning Star(모닝스타)
- Bullish Abandoned Baby(상승 유기아이)
- Three White Soldiers(세명의 흰색군인)
Bearish candlestick patterns on a chart visually show selling pressure. These patterns can show the possibility of a price reversal during an uptrend or the continuation of a downtrend already in place. There can be single bearish candles or bearish candlestick patterns containing multiple candles in row.
차트의 약세 촛대 패턴은 판매 압력을 시각적으로 보여줍니다. 이러한 패턴은 상승 추세 중 가격 반전 가능성 또는 이미 존재하는 하락 추세 지속 가능성을 보여줄 수 있습니다. 단일 약세 양초 또는 연속된 여러 양초를 포함하는 약세 촛대 패턴이 있을 수 있습니다.
Here are some of the most popular bearish candlestick patterns:
다음은 가장 인기 있는 약세 촛대 패턴 중 일부입니다
- Hanging Man(행인맨)
- Shooting Star(별똥별)
- Gravestone Doji(무덤 도지)
- Bearish Spinning Top(하락팽이)
- Bearish Kicker(하락 키커)
- Evening Star(저녁별)
- Bearish Engulfing(하락 인걸핑)
- Bearish Harami(하락 하라미)
- Dark Cloud Cover(검은 구름커버)
- Tweezer Top((쪽집게 상단)
- Bearish Abandoned Baby(상승 유기아이)
- Three Black Crows(세명의 검은 까마귀)
- Evening Doji Star(이브닝 도지별)
- Evening Star(하현달)
'거래기술에 관한 정보' 카테고리의 다른 글
| W Pattern Trading(W 패턴 거래) (0) | 2022.02.07 |
|---|---|
| What is Elliott Wave Theory?(엘리엇 파동 이론이란 무엇입니까?) (0) | 2022.02.06 |
| Day Trading Versus Swing Trading(데이 트레이딩 대 스윙 트레이딩) (0) | 2022.02.04 |
| Top 10 Tips To Give Yourself An Edge Trading(자신에게 엣지 거래를 제공하는 10 가지 팁) (0) | 2022.02.04 |
| Linda Raschke’s 12 Technical Trading Rules:(Linda Raschke의 12가지 기술 거래 규칙:) (0) | 2022.02.03 |