How to Identify A Trend Reversal In A Stock(재고에서 추세 역전현상을 식별하는 방법)
This is a list of things to look for as possible signs before a stock makes a top and rolls over. Alone these are just possibilities but the probabilities increase as more of the signs are in place.(곳곳에 ,있어야할 곳에)
이것은 주식이 탑을 만들고 전복되기 전에 가능한 한 신호를 찾아야 할 사항들의 목록이다. 이것들은 단지 가능성일 뿐이지만 더 많은 징후들이 있을수록 확률은 증가한다.
- When the RSI gets near 70 on the daily chart for a stock and it becomes overbought resistance, the price momentum to the upside slows, and the the price settles into a trading range.
RSI가 주식에 대한 일일 차트에서 70에 가까워지고 그것이 과잉 구매 저항이 되면, 거꾸로의 가격 모멘텀은 느려지고, 가격은 거래 범위로 해결된다.
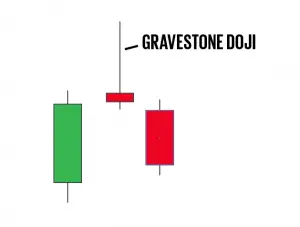
- A Gravestone Doji is a bearish candlestick that indicates a downside reversal could be about to take place. This candle shows a lack of buyers holding positions at higher prices and profit taking setting in(시작하는,~이되는)). Price ends up near where it started after higher prices are rejected.
그레이브스톤 도지는 하락세의 촛대인데, 이 촛대는 곧 하향으로 번복이 일어날 수 있음을 나타낸다. 이 촛불은 높은 가격과 이윤을 창출하는 구매자의 부족을 보여준다. 가격은 더 높은 가격이 거부된 후에 시작했던 곳 근처에 이르게 된다.
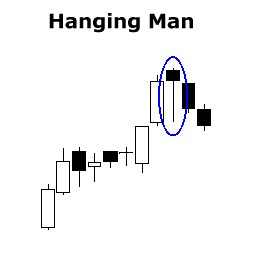
- If the market opens higher but fails to go over the opening price level for the entire trading day, this is a sign that buyers are rejecting higher prices. This is called a hammer or hanging man candlestick.
시장이 더 높게 열리지만 전체 거래일 동안 개장 가격을 넘기지 못하면 바이어들이 더 높은 가격을 거부하고 있다는 신호다. 이것을 망치 또는 달려있는 인간 촛대라고 한다.
- The market opens below the previous days trading range and never gets over the previous days low, that is an early sign of a new trading range.
시장은 전일 거래 범위보다 낮게 열리고 전일 최저치를 결코 넘지 못하는데 이는 새로운 거래 범위의 초기 신호다.
- The market starts to open higher but closes lower, that is a sign of distribution.
시장은 더 높게 열리기 시작하지만 더 낮게 닫히는 것은 분배의 표시다.
- The average daily trading range expands and volatility starts to grow.
하루 평균 거래 범위가 확대되고 변동성이 커지기 시작한다.
- A huge volume day that gaps way up and then sells off into negative territory on high volume.
엄청난 양의 날, 격차는 크게 벌어지다가 대량으로 마이너스 지역으로 팔려나간다.
- A stock is far extended from all moving averages. The odds increase for a reversion to at least the 5 day or 10 day moving average.
주식은 모든 이동평균으로 부터 확정된다. 반전의 확률은 적어도 5일 또는 10일 이동 평균으로 증가한다.
- A major “good news” event happens but with little or no price movement higher, and the market is out of catalysts to drive it higher.
"좋은 소식"이라는 큰 사건이 일어나지만 가격은 거의 또는 전혀 오르지 않고 있으며, 시장은 그것을 더 높이도록 촉매제를 벗어났다
When the majority of people think the stock will not pullback and they are against you short selling the stock.
대부분의 사람들이 그 주식은 회복되지 않을 것이라고 생각했을 때 그리고 그들은 그 주식을 짧게 파는 것에 반대했다.
These are just things to look for that could result in a short term top that lasts weeks or months and maybe nothing more than a pullback or a new range being traded. There are times to buy a breakout and times to wait for a pullback. There is a fine line between chasing the market higher and buying momentum.
이것들은 단지 몇 주 또는 몇 달 동안 지속되는 단기적인 탑을 야기할 수 있고 아마도 풀백이나 새로운 범위의 트레이드 되는 것에 지나지 않을 것이다. 탈출을 살 때도 있고 풀백을 기다릴 때도 있다. 더 높은 상승시장을 잡는 것과 모멘텀을 사는 것 사이에는 미묘한 차이가 있다.
'거래기술에 관한 정보' 카테고리의 다른 글
| The 7 Trading Habits of Paul Tudor Jones:(폴 튜더 존스의 7거래 습관:.) (0) | 2019.11.26 |
|---|---|
| A Traders Quick Guide to Position Sizing:(포지션사이징에 대한 트리이더의 빨은 가이드라인 ) (0) | 2019.11.26 |
| What Is ITM.OTM ATM????(ITM이란 무엇인가.OTM ATM?? ) (0) | 2019.11.21 |
| What Is A Call Option?(통화 옵션이란 무엇입니까?) (0) | 2019.11.21 |
| As traders begin the journey,(거래자들이 여행을 시작하면서) (0) | 2019.11.19 |

