Chart Patterns Cheat Sheet(차트 패턴 치트 시트)
A chart pattern is simply a visual representation of the prices buyers and sellers bought and sold in the past. There is no magic in a chart pattern they just show you what happened in the past and what has a higher probability of happening in the future.
A chart pattern can show that a stock is in a range with defined resistance and support. A chart could also show an uptrend of higher highs and higher lows are a downtrend of lower highs and lower lows.
차트 패턴은 단순히 구매자와 판매자가 과거에 사고 팔았던 가격을 시각적으로 표현한 것입니다. 차트 패턴에는 마법이 없으며 단지 과거에 일어난 일과 미래에 일어날 더 높은 확률이 있음을 보여줍니다.
차트 패턴은 주식이 정의된 저항과 지지가 있는 범위에 있음을 보여줄 수 있습니다. 차트는 또한 더 높은 고점의 상승 추세를 보여줄 수 있었으며 높은 저점이은 낮은 고점과 낮은 저점이다
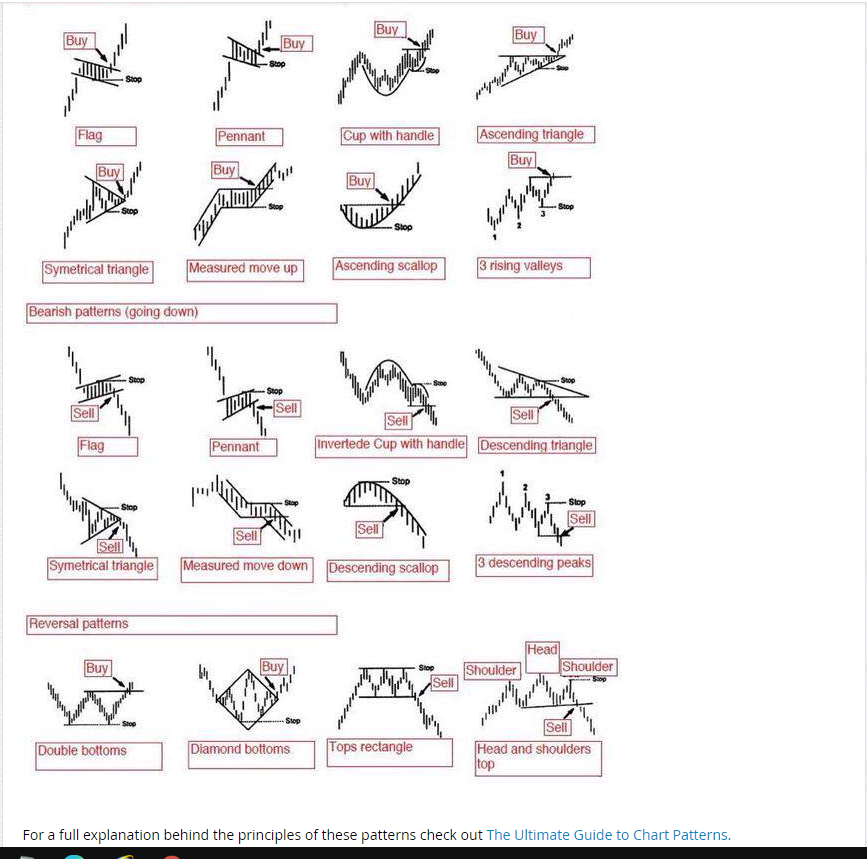
The most popular use of chart patterns is for breakout trading signals as the probability increases of a move in a specific direction after a price breakout of a previous support or resistance.
차트 패턴의 가장 널리 사용되는 용도는 이전지지 또는 저항의 가격 돌파 이후 특정 방향으로 이동할 확률이 높아짐에 따라 돌파 거래 신호를 위한 것이다.
Chart patterns can be bullish, bearish, or show a price reversal depending on the direction of the momentum. They can also be used as risk management tools showing where to set stop losses if a breakout fails or set profit targets for a continuation.
차트 패턴은 모멘텀의 방향에 따라 강세, 약세 또는 가격 반전이 될 수 있다 그들은(패턴) 이탈이 실패하거나 계속을 위한 이익목표를 설정한다면 중지손실을 어디에 설정할 것인지를 보여주는 위험관리 기구로서 사용될 수 있다
A chart pattern is a visual tool for seeing which direction a market is moving in.
차트 패턴은 시장이 움직이는 방향을 보기 위한 시각적인 기구이다

'거래기술에 관한 정보' 카테고리의 다른 글
| Boss Makes A Dollar, I Make A Dime(보스가 달러를 벌고, 나는 한푼을 번다) (0) | 2021.06.18 |
|---|---|
| Most Profitable Chart Patterns(가장 수익성 있는 차트패턴) (0) | 2021.06.18 |
| EBITDA Meaning(EBITDA 의미) (0) | 2021.06.15 |
| Wall Street Cheat Sheet(월스트리트 치트 시트) (0) | 2021.06.15 |
| 5 Steps To Creating A Price Action Trading System:(가격 행동 거래 시스템을 만드는 5 단계 :) (0) | 2021.06.13 |