Reverse Cup and Handle(역전 컵과 손잡이)
BySteve Burns
The reverse cup with handle is a reversal pattern and momentum sell short signal as it breaks down out of the ‘handle’ in the formation. It is usually a topping pattern after a strong move to the upside signaling the end of an uptrend on a chart.
핸들이 있는 거꾸로 된 컵은 반전 패턴이며 포메이션의 '핸들'에서 이탈하면서 모멘텀 공매도 신호입니다. 일반적으로 차트에서 상승세의 끝을 알리는 상승세로의 강한 움직임 이후에 나타나는 상단 패턴입니다.
A reverse cup and handle chart pattern ideally takes place at the end of uptrends when the chart are near all time highs in price.
거꾸로 된 컵 앤 핸들 차트 패턴은 차트가 가격이 사상 최고치에 근접할 때 상승 추세가 끝날 때 이상적으로 발생합니다.
In order for the reverse cup and handle short setup to have the highest odds of succeeding, it should come after a clear uptrend was in place. The chart pattern consists of two key components: The rolling over price action of the upside down cup and the failed rally in the inverted handle.
거꾸로 된 컵과 핸들 빠른 설정이 성공할 확률이 가장 높기 위해서는 뚜렷한 상승세가 자리 잡은 후에 이뤄져야 한다. 차트 패턴은 두 가지 주요 구성 요소로 구성됩니다. 즉 뒤집힌 컵의 가격조치에 대한 기복(울렁거림)과 뒤집힌 손잡이의 실패된 회복 두개이다 .
The cup part of the formation is created when profit taking sets in on every attempt to make a new high in price and the market begins to slowly go into a distribution phase instead of rallying to new highs. The inverted cup top is formed when the stock finally runs out of buyers at new high prices and sellers start moving in and bidding the stock down.
포메이션의 컵 부분은 새로운 고점을 만들기 위한 모든 시도에서 이익 창출이 시작되고 시장이 새로운 고점으로 회복하는 대신 천천히 분배 단계로 들어가기 시작할 때 생성됩니다. 거꾸로 된 컵 탑은 주식이 마침내 새로운 높은 가격에 구매자가 없어지고 판매자가 움직이기 시작하고 주식을 내리기 시작할 때 형성됩니다.
Most of the time as the chart emerges out of the right side of the inverted cup and begins to fall it fails to break down and meets support the first time it tries to break out to new lows in price. This is when the pattern forms an inverted handle inside a trading range. The second run at new lows usually works as the majority of buyers have been worked through and the stock breaks down to new lows.
대부분의 경우 차트가 뒤집힌 컵의 오른쪽에서 나와 떨어지기 시작하면서 차트가 아래로 하락하지 않고 처음으로 최저가로 발생하려고 할 때 지지를 받는다. 이것은 패턴이 거래 범위 내에서 거꾸로 된 핸들을 형성하는 경우입니다. 새로운 최저점에서 두 번째 실행은 일반적으로 대다수의 구매자가 작업을 완료하고 주식이 새로운 최저점으로 떨어질 때 작동합니다.
This pattern sets the stage for a big downtrend because the majority of short term traders bought as the stock fell out of the bottom of the inverted cup, the top was formed when the potential buyers of the chart on the sidelines refused to buy the highs of the resistance level at the top of the inverted cup, then new buyers were worked through as the market fell through the right side of the inverted cup.
이 패턴은 큰 하락세의 발판을 마련합니다. 왜냐하면 주식이 거꾸로 된 컵의 바닥에서 떨어질 때 매수한 대부분의 단기 트레이더가, 사이드라인에 있는 차트의 잠재적인 구매자가 고점의 매수를 거부할 때 고점이 형성되기 때문입니다. 거꾸로 된 컵의 상단에서 저항 수준, 시장이 거꾸로 된 컵의 오른쪽을 통해 떨어지면서 새로운 구매자가 작동했습니다.
Buyers at new resistance highs near the top were the last buyers of the chart as it failed to break out of the inverted cup pattern because of a lack of buyers at those prices.
상단 부근의 새로운 저항 고점에 있는 구매자는 해당 가격의 구매자가 부족하여 반전 컵 패턴을 벗어나지 못했기 때문에 차트의 마지막 구매자였습니다.
The chart then swings down in price as stop losses and trailing stop signals are triggered for exits on many open positions.
그런 다음 차트는 많은 미결 포지션의 출구에 대해 손절매와 추적 정지 신호가 발생함에 따라 가격이 하락합니다.
● Reverse cup and handle patterns are not good probability trades if the general market fails to go into a pullback or correction.
리버스 컵 및 핸들 패턴은 일반 시장이 후퇴 또는 조정에 빠지지 않는 경우 좋은 확률 거래가 아닙니다.
● The pattern has better odds of playing out as expected if it belongs to a lagging stock in the market with declining sales and earnings growth.
그 패턴은 매출과 이익 성장이 감소하는 시장에서 뒤처진 주식에 속할 경우 예상대로 더 나은 결과를 보일 가능성이 있습니다.
● The stock should have had a previous uptrend leading into this pattern.
주식은 이 패턴으로 이어지는 이전의 상승세를 가졌어야 했습니다.
● Look for a classic shape. If you have to argue your way mentally into believing the shape is an inverted cup, it’s not an inverted cup. The trend line needs to curve up and then down like an upside down cup.
고전적인 모양을 찾으십시오. 모양이 거꾸로 된 컵이라고 정신적으로 주장해야한다면 거꾸로 된 컵이 아닙니다. 추세선은 거꾸로 된 컵처럼 위아래로 구부러져야 합니다.
● Look for an inverted ‘U’ shape and volume that dries up near the cup’s high. Volume that dries up at the top suggests funds lost interest in buying. And inverted U-shaped bases are more likely to work than inverted V-shapes.
컵 높이 근처에서 마르는 거꾸로 된 'U'자 모양과 부피를 찾으십시오. 상단에서 마른 볼륨은 자금이 구매에 대한 관심을 잃었음을 시사합니다. 그리고 거꾸로 된 U자형 베이스는 거꾸로 된 V자형보다 작동할 가능성이 더 큽니다.
● Reverse cup and handle patterns can happen on both daily and weekly charts.
역 컵 및 핸들 패턴은 일간 및 주간 차트 모두에서 발생할 수 있습니다.
● This pattern has a higher probability of success if the breakdown of the handle low or support of the bottom of the cup lip happens on higher volume than the 10-day average volume of trading.
이 패턴은 10일 평균 거래량보다 높은 거래량에서 손잡이 낮은 부분의 이탈이나 컵 주둥이 바닥의 지지가 발생하는 경우 성공 확률이 더 높습니다.
● This pattern is trying to capture a short stock position as it breaks down out of its handle and starts a downtrend due to distribution from money managers.
이 패턴은 펀드매니저의 분배로 인해 핸들에서 내려가 하락추세를 시작함에 따라 숏 스톡 포지션을 포착하려고 합니다.
● The buy point is a momentum short signal as the stock makes a new low outside the bottom of the inverted cup. The stop loss can be set on the top of the ascending trendline of the inverted handle.
주식이 거꾸로 된 컵 바닥 밖에서 새로운 저점을 만들 때 매수 포인트는 모멘텀 숏 신호입니다. 역손잡이의 오름차순 추세선 상단에 손절매를 설정할 수 있습니다.
● A price target to the downside could be between 20%-50% but they can go lower and of course they can also rise back in price into the inverted handle and fail. A trader has to follow how it plays out by letting winning trades run but cutting losing trades short.
하방에 대한 목표 가격은 20%-50%일 수 있지만 더 낮아질 수 있으며 물론 가격이 거꾸로 상승하여 실패할 수도 있습니다. 거래자는 이기는 거래를 실행하고 손실 거래를 짧게 줄임으로써 그것이 어떻게 진행되는지 따라야 합니다.
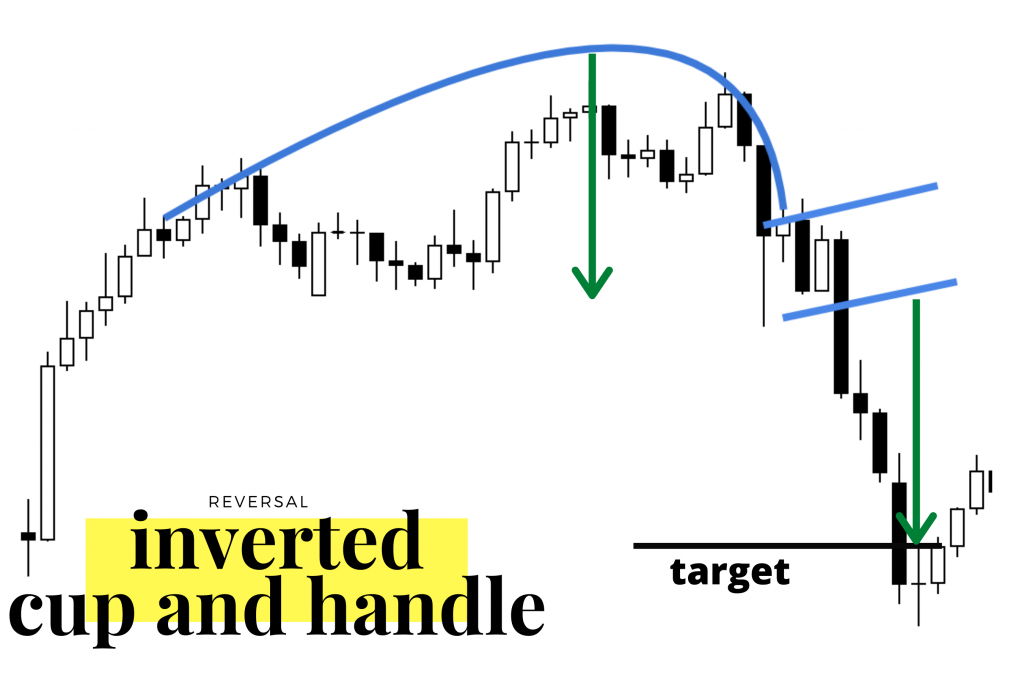
Image by ColibriTrader.com
This ExxonMobil chart below shows an inverted cup pattern from January through May as new highs failed to hold and price went lower after the peak. From June through mid-July an inverted handle formed inside the range of the inverted cup which looks like a vertical ascending price range channel. The breakdown of the lower vertical trend line support signaled a new swing down in price action from the middle of July through August.
아래의 이 ExxonMobil 차트는 1월부터 5월까지의 컵 패턴이 역전된 패턴을 보여줍니다. 이는 새로운 최고점을 유지하지 못하고 최고점 이후 가격이 하락했기 때문입니다. 6월부터 7월 중순까지 수직 상승 가격대 채널처럼 보이는 거꾸로 된 컵의 범위 안에 거꾸로 된 손잡이가 형성됩니다. 더 낮은 수직 추세선 지지선의 붕괴는 7월 중순부터 8월까지 가격 움직임의 새로운 하락을 알렸습니다.

Chart courtesy of @TrendSpider_J(@TrendSpider에서 제공)
For a deep look at all the most popular chart pattern you can check out my book The Ultimate Guide to Chart Patterns available on Amazon.
가장 인기 있는 모든 차트 패턴을 자세히 보려면 Amazon에서 사용할 수 있는 내 책 The Ultimate Guide to Chart Patterns를 확인할 수 있습니다.
'거래기술에 관한 정보' 카테고리의 다른 글
| The training of a stock trader is like a medical education.(주식 거래자의 훈련은 의학 교육과 같습니다) (0) | 2022.02.14 |
|---|---|
| 30 Reasons Most Traders Don’t Make Money(대부분의 트레이더가 돈을 벌지 못하는 30가지 이유) (0) | 2022.02.12 |
| RSI Indicator Cheat Sheet(RSI 지표 치트 시트) (0) | 2022.02.08 |
| W Pattern Trading(W 패턴 거래) (0) | 2022.02.07 |
| What is Elliott Wave Theory?(엘리엇 파동 이론이란 무엇입니까?) (0) | 2022.02.06 |