How To Trade A Symmetrical Triangle Pattern(대칭 삼각형 패턴의 교환 방법)
Symmetrical Triangle Pattern
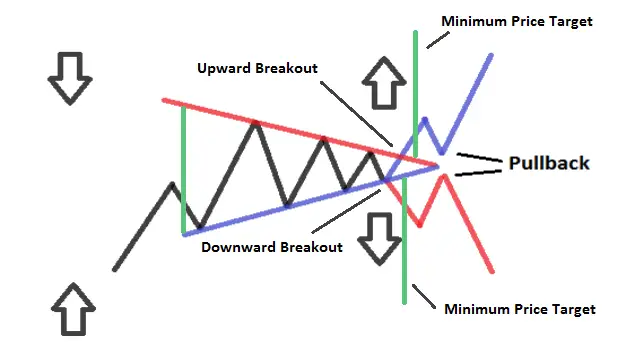
Chart Facts:
The symmetrical triangle is a neutral chart pattern that usually forms during a trend as a continuation pattern of the existing trend.
대칭 삼각형은 일반적으로 추세 동안 기존 추세의 연속 패턴으로 형성되는 중립 차트 패턴입니다.
Sometimes an symmetrical triangle pattern will form as a reversal pattern as a trend comes to an end, but they are usually continuation patterns of an existing trend
추세가 끝날 때 대칭 삼각형 패턴이 반전 패턴으로 형성되는 경우가 있지만 일반적으로 기존 트렌드의 연속 패턴입니다.
When the descending and ascending trend lines converge(수렴하다) the symmetrical triangle takes shape.
내림차순 및 오름차순 추세선이 수렴하면 대칭 삼각형이 형성됩니다.
A symmetrical triangle has a wide trading range at the beginning of the pattern and compresses(압축하다) to a very small range as the pattern plays out.(끝내다)
대칭 삼각형은 패턴의 시작 부분에서 거래 범위가 넓고 패턴이 시작될 때 매우 작은 범위로 압축됩니다.
The symmetrical pattern creates a coil and contains at least two lower highs and two higher lows for a compression of the price range into an apex point.
대칭 패턴은 코일을 생성하고 가격 범위를 정점으로 압축하기 위해 최소 2 개의 낮은 최고 값과 2 개의 높은 최저값을 포함합니다.
The lower highs is a sign of buyers losing interest for higher prices at the same time that higher lows show that sellers are not letting their position go at lower prices as the pattern makes higher lows at the same time it is making lower highs.
낮은 고점은 구매자가 고가에 대한 관심을 잃는 동시에 저점이 높을수록 패턴이 고점을 만드는 동시에 패턴이 높은 저점을 만들 때 판매자가 더 낮은 가격으로 자신의 입장을 포기하지 않음을 나타냅니다.
The top descending resistance line on this pattern trends downward at the same time that the lower support line trends up with higher lows.
이 패턴의 상단 내림 저항선은 하단 지지선이 더 높은 하위로 상승하는 것과 동시에 하향 추세에 있다.
Symmetrical triangle patterns can be longer in timeframe and wider in range than the similar pennant pattern but is usually longer in duration(지속기간) than a pennant.(우승기)
대각 삼각형 패턴은 유사한 페넌트 패턴보다 시간 범위가 길고 범위가 넓을 수 있지만 일반적으로 페넌트보다 지속 시간이 더 깁니다
Many times volume will contract as the pattern gets near to its apex. A breakout with higher than average volume can give a higher rate of success for a buy signal.
패턴이 정점에 가까워지면 많은 양이 줄어들 것이다. 평균보다 높은 볼륨의 단절이 구매 신호의 성공률을 높일 수 있다.
As a symmetrical triangle expands and the trading range shrinks, volume should start to decline. This can be a compression in price action before a break out.
.대칭적 삼각형이 확장되고 거래범위가 축소되면서 물량은 감소하기 시작해야 한다. 이것은 파손되기 전의 가격 행동의 압축이 될 수 있다
- Traditionally the price projection for this pattern after the breakout is found by measuring the longest distance in the price range of the pattern and projecting after the resistance breakout.전통적으로 이 패턴에 대한 가격 예측은 패턴의 가격 범위에서 가장 긴 거리를 측정하고 저항성 이탈 후 투영함으로써 발견된다.
This $XLE chart below shows a symmetrical triangle after a 3 month trading range. Unlike the pennant chart pattern it did not follow an uptrend. This triangle could have broken either way but the break out of the apex(꼭대기) as the two trend lines met was upwards and followed through(뻗치다) for a trend from the break out at $69 to $75. The high of the triangle was near $70 and the low was near $67 so a target of a $3 move would have been a good goal. This pattern doubled that for a great gain.
아래 XLE 도표는 3개월간의 거래 범위 후 대칭 삼각형을 보여준다. 페넌트 차트 패턴과는 달리 그것은 상승세를 따르지 않았다. 이 삼각형은 어느 쪽이든 부러질 수 있었지만, 두 추세선이 만나면서 정점으로부터의 이탈은 상승했고, 69달러에서 75달러까지의 추세에서 벗어났다. 삼각형의 최고가 70달러에 가까웠고 최저가 67달러에 가까웠기 때문에 3달러의 이동 목표가 좋은 목표였을 것이다. 이 패턴은 큰 이익을 위해 그것을 두 배로 증가시켰다.
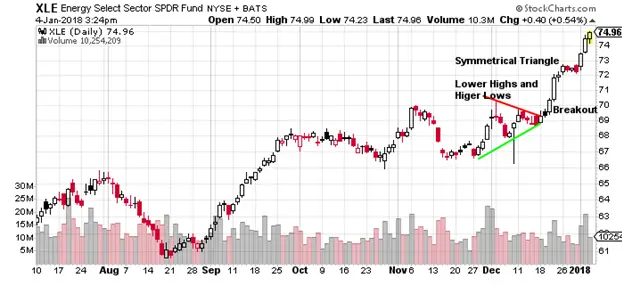
Chart Courtesy of StockCharts.com
Chart Summary: The symmetrical triangle is a neutral chart pattern with resistance at the top descending vertical trend line that is making lower highs and support at the ascending vertical trend line that is making higher lows. A breakout of the descending trend line near the apex of the converging trend lines is the signal which can be a bullish or bearish entry signal based on the direction of the break out. A stop loss could be set for if price returns and closes on the other side of the apex of trend line convergence. The gain if the pattern breaks and trends could be equal to the size of the largest area of the trading range inside the pattern. A price target could be for a run after the breakout equal to the largest point of the trading range inside the triangle.
차트 요약: 대칭 삼각형은 높은 저점을 만드는 상승 수직 추세선에서 낮은 최고치와 지원을 만드는 상단 내림차순 수직 추세선에 저항이있는 중립 차트 패턴입니다. 수렴 추세선의 정점 근처의 내림차순 추세선의 브레이크아웃은 브레이크아웃 방향에 따라 강세 또는 약세 진입 신호가 될 수 있는 신호입니다. 추세선 수렴의 정점 의 반대편에 가격이 반환되고 닫히는 경우 정지 손실을 설정할 수 있습니다. 패턴이 깨지고 추세가 패턴 내부의 거래 범위의 가장 큰 영역의 크기와 같을 수 있는 이득. 가격 목표는 삼각형 내부의 거래 범위의 가장 큰 지점과 동일한 브레이크 아웃 후 실행에 대한 수 있습니다.