In statistics, the standard deviation is a measurement of the magnitude of variation of a set of numbers that represent values. A smaller standard deviation shows that values are closer to the mean or average expectations of a set of data. A higher standard deviation shows that the values are more varied and over a larger range of possibilities extended from the average.
통계에서 표준 편차는 값을 나타내는 숫자 집합의 변동 크기를 측정하는 것이다. 표준 편차가 작을수록 값들이 데이터 집합의 평균 또는 평균 기대치에 더 가깝다는 것을 알 수 있다. 더 높은 표준 편차는 값이 다양하고 평균에서 확장된 더 큰 범위의 가능성을 초과한다는 것을 보여준다.
A standard deviation can also be represented in a formula with the Greek letter sigma ‘σ’ or simply with the Latin letter ‘s’..
In investing and trading if price points are extended far from the average of prices that means there is a higher standard deviation of asset prices and it is volatile and tends to move in a larger trading range.
투자 및 거래에서 가격 포인트가 자산 가격의 표준 편차가 높고 변동성이 있으며 더 큰 거래 범위에서 이동하는 경향이 있음을 의미하는 가격의 평균과 멀리 확장된다면 표준 편차는 그리스 문자 시그마 'σ' 또는 라틴 문자 's'로 간단히 나타낼 수도 있다
A standard deviation is also a way to measure statistically the annual rate of return of a market or stock to see the historical volatility of that investment or trading vehicle.
표준편차는 또한 과거 변동성과 거래차량을 확인하여 시장이나 주식의 연간 수익률을 통계적으로 측정하는 방법이다
A volatile market or speculative stock will tend to have a higher standard deviation of prices on average while most big cap stocks and stock market indexes will usually have a lower standard deviation and stay closer to historical prices most of the time.
변동성 있는 시장이나 투기성 주식은 평균 가격의 표준 편차가 더 높은 경향이 있는 반면, 대부분의 대형 주식과 주식 시장 지수는 표준 편차가 낮으며 대부분 역사적 가격에 근접할 것이다.
Standard deviation is also used in risk management to measure the possible downside. It calculates all the volatility and uncertainty in both up and down prices as part of the risk in a market. Price movement is all measured as part of the risk of a standard deviation whether it’s in the investor’s or trader’s favor or not.
또한 가능한 하향점을 측정하기 위해 위험 관리에 표준 편차를 사용한다. 그것은 시장의 위험의 일부로서 상승과 하락의 모든 변동성과 불확실성을 계산한다. 가격 이동은 모두 투자자 또는 거래자에게 유리하든 않든 표준 편차의 위험의 일부로 측정된다.
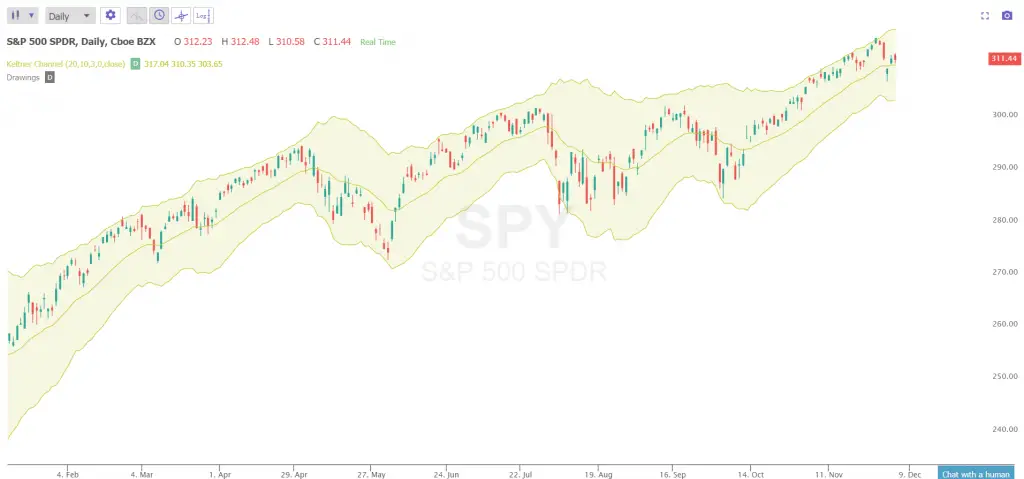
In trading and investing the standard deviation is used to measure the volatility of price action in the context of a price range and the distance from a key moving average. Some of the most popular technical indicators used to measure the standard deviation of prices is Bollinger Bands and Keltner Channels.
거래와 투자에서 표준 편차는 가격 범위의 전후로 보이는 가격조치의 변동성과 주요 이동 평균과의 거리를 측정하기 위해 사용된다. 가격 표준 편차를 측정하는 데 사용되는 대표적인 기술지표로는 볼링거 밴드와 켈트너 채널이 있다
The wider the distance between the ‘bands’ of these indicators from the moving average the more volatile the market is said to be, The more that current price pushes against the outer bands of these indicators the stronger the trend in one direction has become. The longer that price action stays extended to multiple standard deviations from the moving average the greater the odds of an eventual return to the average becomes, this is called a reversion to the mean.
이동평균에서 이들 지표의 '밴드' 간 거리가 넓을수록 시장은 변동성이 커진다고 하는데, 현재의 가격이 이들 지표의 외측 대역을 밀어붙일수록 한 방향으로의 추세는 더욱 강해졌다. 가격조치가 이동평균에서 복수의 표준편차로 연장되는 기간이 길어질수록 결국 평균으로 돌아올 확률은 더 커지며, 이를 평균으로의 회귀라고 한다.
The more narrow that Bollinger Bands or Keltner Channels become and the closer they are to current prices the lower the volatility is on a chart. If price is very close to its short term moving averages then the market currently has low volatility and in a tight trading range.
볼링거 밴드나 켈트너 채널이 좁아질수록 현재 가격에 가까울수록 변동성은 낮아진다. 만약 가격이 단기 이동 평균에 매우 근접한다면, 시장은 현재 낮은 변동성을 가지고 있고 거래 범위가 빠듯하다
Standard deviation expands during volatile markets and contracts during calm markets. Fear and uncertainty are generally the drivers of expanded volatility in markets price action
변동성이 큰 시장에서는 표준 편차가 확대되며, 조용한 시장에서는 계약이 확대된다. 공포와 불확실성은 일반적으로 시장 가격 행동의 확대된 변동성의 원동력이다.
The formula for calculating a standard deviation is:
표준 편차를 계산하는 공식은 다음과 같다.
| = | sample standard deviation(표준편차샘플) | |
| = | the number of observations(관찰 수) | |
| = | the observed values of a sample item(관찰된 샘플항목의 가격) | |
| = | the mean value of the observations(관찰된 가격평균) |

Keltner Channel Showing Three Standard Deviations from the 20 day exponential moving average
20일 지수평균으로부터의 세 표준편차를 보여주는 Keltner Chennel)