Current Chart Patterns And Key Resistance Lines(현재 차트 패턴 및 주요 저항선)
This is a Guest Post by Jake @TrendSpider.
In this weekend’s analysis, we take a look at the broad market ETF’s had quite a whipsaw(회사를 결탁시켜 유리하게 이끌다) week. Don’t miss the TrendSpider Sunday Chart show at 6 PM EST as we discuss the markets into the final weeks of 2019 with Greg Krupinski. Register below!
이번 주말 분석에서, 우리는 ETF가 한 주 동안 꽤 많은 수익을 올린 넓은 시장을 살펴본다. Greg Krupinski와 2019년 마지막 주에 시장에 대해 토론할 때, 오후 6시에 열리는 TrendSpider Sunday Chart쇼를 놓치지 마십시오. 아래에 등록하십시오!
TrendSpider Sunday Chart Show with Greg Krupinski
Founder of: gktrading.net
그렉 크루핀스키와 트렌드스파이더 선데이 차트쇼
설립자: gktrading.net

Sign Up Here!
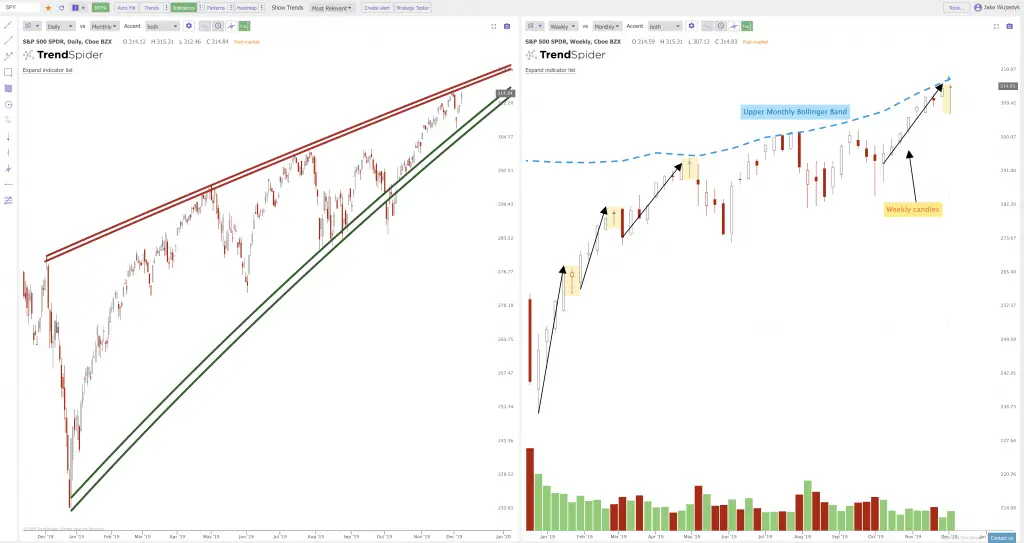
SPY: Daily vs. Weekly Chart with Monthly Overlay(덮어씌움:중첩)
SPY: 일용 vs. 월별 중첩이 있는 주간 차트(덮어씌움)

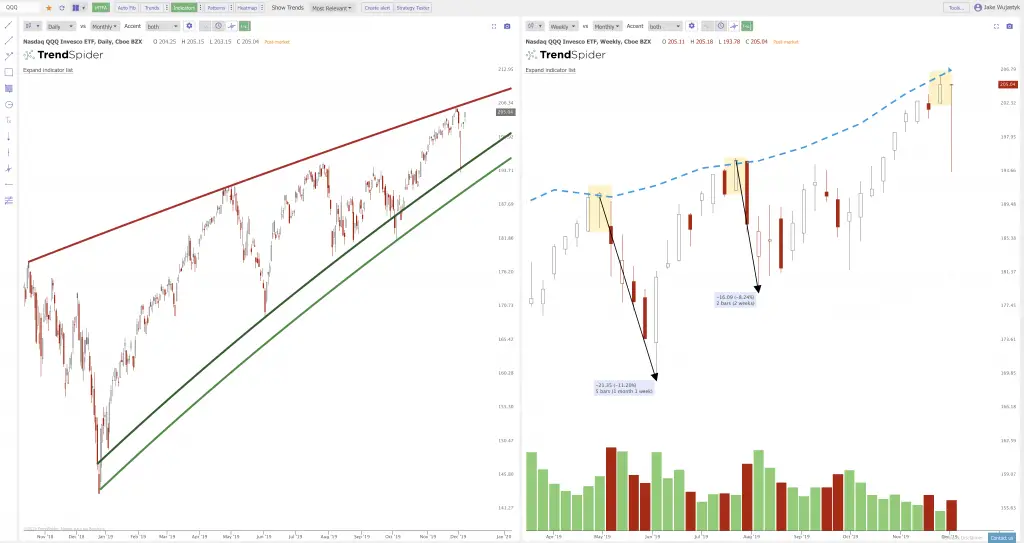
QQQ: Daily vs. Weekly Chart with Monthly Overlay
QQQ: 일일 vs. 월별 중첩을 사용한 주간 차트

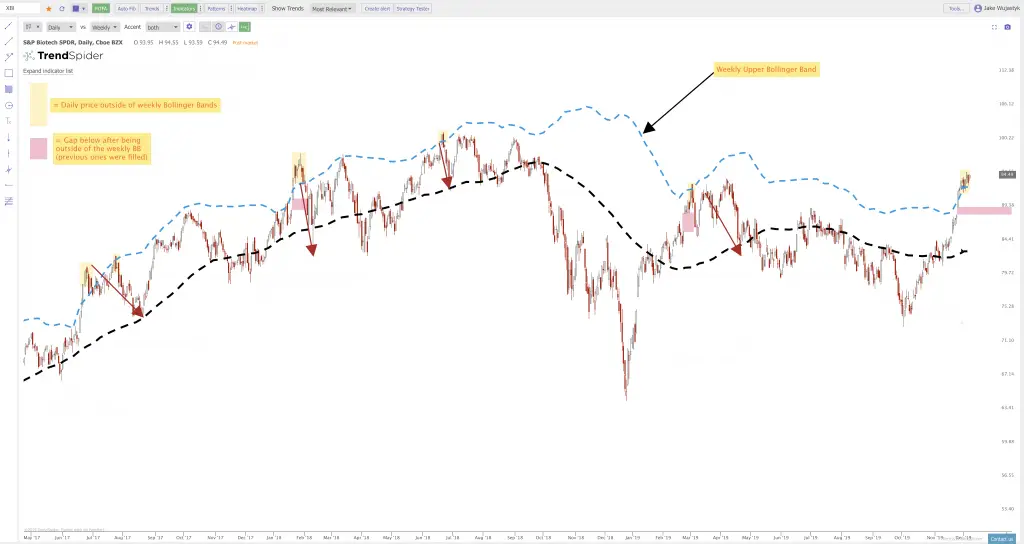
XBI: Daily Chart with Weekly Overlay(덮어씌움):XBI: 주간 중첩이 있는 일일 차트

Related Blog Posts(관련 블로그 게시물)
Alerts – Add alerts to your trendlines and indicators with sensitivity.
알림 – 추세선 및 표시기에 민감하게 알림 추가
Raindrops – Visualize volume and price action in a completely new way by visualizing volume flow throughout a specific time period.
레인드롭 – 특정 기간 동안 볼륨 흐름을 시각화하여 완전히 새로운 방식으로 볼륨 및 가격 동작을 시각화하십시오.
Conditional Criteria Alerts – Create complex conditions to be met between a mix of lower indicators and price action.
조건 기준 알림 – 더 낮은 지표와 가격 조치의 혼합물 사이에서 충족해야 할 복잡한 조건을 조성한다.
Multi-time frame analysis (MTFA) – Overlay your chart a secondary timeframe with on trendlines, indicators, and Fibonacci levels.
MTFA(Multi-time Frame Analysis) – 추세선, 지표 및 피보나치 레벨에 있는 보조 시간대 차트에 중첩하십시오.
Trendline Preferences – Customize your trendlines to automate a consistent trendline drawing strategy.
Trendline Preferences – 추세선을 사용자 지정하여 일관된 추세선 그리기 전략을 자동화하십시오.
Add Watchlist – Create your own watchlist and quickly move through charts with automatic analysis on each!
.감시자 추가 – 자체 시계 목록을 생성하고 각 차트에 대한 자동 분석으로 차트를 빠르게 이동하십시오
Automatic Candlestick Recognition – Automatically input your favorite candlestick patterns into the system and have TrendSpider find all the ones on your current chart!
자동 캔들스틱 인식 – 좋아하는 촛대 패턴을 자동으로 시스템에 입력하고 TrendSpider가 현재 차트에서 모든 패턴을 찾도록 하십시오!
Enjoyed this blog? Make sure to click on the links below to follow us on social media for intra-week chart updates:
StockTwits
Facebook
Twitter
LinkedIn
REMEMBER: These are charts that have interesting technical setups based on automated technical indicator analysis included. Charts and analysis provided for educational reasons only. TRENDSPIDER IS A CHART ANALYSIS PLATFORM. IT IS NOT INTENDED TO BE TRADING OR INVESTING ADVICE. ALWAYS DO YOUR OWN DUE DILIGENCE USING MULTIPLE SOURCES OF INFORMATION AND/OR SEEK THE ADVICE OF A LICENSED PROFESSIONAL BEFORE TRADING OR INVESTING. Please read our full risk disclaimer on our website by clicking here.
기억하십시오 : 여기에는 자동화 된 기술 지표 분석을 기반으로 흥미로운 기술 설정이 포함 된 차트가 있습니다. 교육 이유 만 제공 차트 및 분석. TRENDSPIDER는 CHART 분석 플랫폼이다. IT는 무역 또는 투자 조언 수 없습니다. 항상 다양한 정보 소스를 사용하거나 거래 또는 투자 전에 라이센스가있는 전문가의 조언을 구하십시오. 여기를 클릭하여 웹 사이트에서 전체 위험 고지 사항을 읽으십시오.
'거래기술에 관한 정보' 카테고리의 다른 글
| A Moving Average Strategy that Beats Buy and Hold:(Buy and Hold를 능가하는 이동 평균 전략 :) (0) | 2019.12.10 |
|---|---|
| What Is Passive Income?(패시브 소득이란?) (0) | 2019.12.09 |
| 7 Reasons to Never Give Up Trading:(거래를 포기하지 않는 7가지 이유:) (0) | 2019.12.08 |
| trading books My Book Review of The Man Who Solved The Market(거래 책 시장을 해결 한 사람에 대한 내 서평) (0) | 2019.12.07 |
| How To Calculate ROI(ROI 계산 방법) (1) | 2019.12.07 |