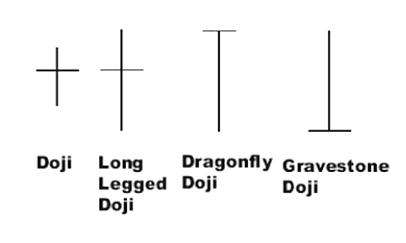
The doji candlestick is a chart pattern in technical analysis that is usually formed from a small trading range in a time period where both the open and closing price are nearly equal. A doji candlestick usually signals indecision for a direction in a market. A doji is not very significant inside a range bound market that is not clearly trending in one direction as the market is already indecisive.
A doji that forms after a long term trend in one direction has more meaning as a potential signal for a reversal or end of a current trend. A doji shows the beginning of a loss of momentum in the current market direction as equilibrium is reached for buyers and sellers at the same price point by the end of trading that time period.
도지 촛대는 일반적으로 개방가격과 종가격이 거의 같은 시기에 작은 거래범위에서 형성되는 기술분석에서의 도표 패턴이다. 도지 촛대는 보통 시장에서의 방향을 결정하지 못한다는 신호를 보낸다. 도지는 이미 시장이 우유부단하기 때문에 한 방향으로 뚜렷하게 추세가 진행되지 않는 범위 한정된 시장 내에서는 별로 의미가 없다.
한 방향에서 장기 추세를 거쳐 형성되는 도지는 현재 추세의 반전이나 종말의 잠재적 신호로서 더 큰 의미를 갖는다. 도지는 그 기간의 거래가 종료될 때까지 동일한 가격으로 구매자와 판매자의 평형에 도달함에 따라 현재의 시장 방향에서 모멘텀 상실의 시작을 보여준다.

Doji stars are created when opening and closing prices are close to the same, outside the context of a chart dojis are neutral patterns. A doji can signal the end of a trend when it forms in an extremely overbought or oversold market.
도지별은 개폐 가격이 같을 때 생성되며 도지의 맥락 밖은 중립적인 패턴이다. 도지는 그것이 지나치게 비싸게 팔리거나 지나치게 팔리는 시장에서 형성될 때 유행의 종말을 알리는 신호일 수 있다.
A long legged doji shows a lot of indecision about the trend continuing. The longer the wicks the greater the indecision in the market. These can happen to set potential tops or bottoms in charts that are very extended from key moving averages.
다리가 긴 도지는 이런 추세가 계속되는 것에 대해 많은 우유부단함을 보여준다. 심지가 길어질수록 시장의 우유부단함은 더 커진다. 이는 주요 이동 평균에서 매우 확장된 차트에서 잠재적 상단 또는 하단을 설정하는 경우가 발생할 수 있다.
The Dragonfly doji is created when the opening and closing price are near the same and both happen near the highest prices of the time period. It has a long lower wick that can signal that the direction of a downtrend may be at a turning point when they happen after a long sequence of lower highs and lower lows.
잠자리 도지는 개폐 가격이 거의 같을 때 만들어지며 둘 다 그 시대의 최고 가격 근처에서 일어난다. 그것은 긴 낮은 심지를 가지고 있어서 그들이 낮은 고도와 낮은 저도의 긴 연속으로 발생했을 때 하강 추세의 방향이 전환점에 있을 수 있다는 신호를 보낼 수 있다.
The Gravestone doji is creates when both the opening and closing prices in the time frame are close to the same and happen near the low of the time frame. It usually has a very long upper wick on the candle showing that sellers came in all day to reject further upward movement of the trend and can be a signal that the uptrend is close to reversing and going sideways or down.
Candlestick signals have more meaning after they receive confirmation of the projected move on the appearance of the next candle in that direction.
그레이브스톤 도지는 그 기간의 개폐 가격이 거의 같을 때 생성되며, 그 기간이 가장 낮은 시기에 발생한다. 그것은 보통 양초에 매우 긴 위쪽 심지를 가지고 있는데, 판매자들이 추세의 더 이상의 상승 움직임을 거부하기 위해 하루 종일 들어왔다는 것을 보여주며, 상승세가 역전되어 옆으로 또는 아래로 향한다는 신호가 될 수 있다.
캔들스틱 신호는 그 방향으로 다음 촛불의 출현에 대한 예측된 움직임을 확인한 후에 더 큰 의미를 갖는다.