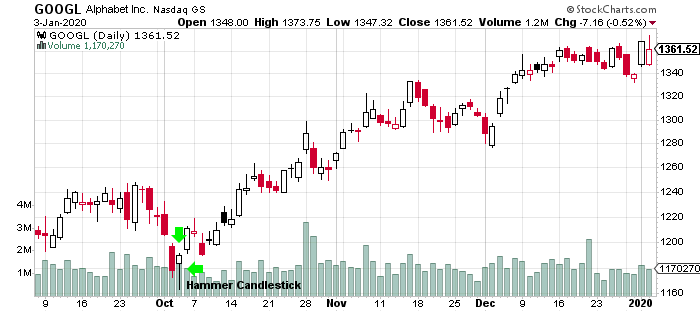
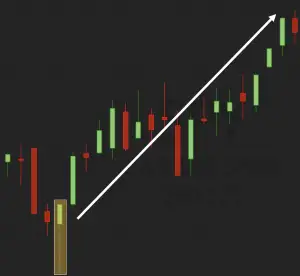
A hammer is a candlestick pattern when a stock opens then moves a lot lower during the day then rallies back near the opening price. This candlestick pattern looks like a hammer with the long lower wick from the lows of the day looking like the handle and the opening and closing price body form what looks like the hammer’s head. The lower wick is usually twice the size of the candle body but can be even bigger.
해머는 주식이 열렸을 때 촛대 패턴으로 낮에는 낮게 움직 인 후 개정가격 근처에서 랠리합니다. 이 촛대 패턴은 손잡이처럼 보이는 낮의 낮은 심지가 긴 망치처럼 보이고 망치의 머리처럼 보이는 개폐 가격 본체를 형성합니다. 낮은 심지는 일반적으로 양초 몸체의 두 배 크기이지만 더 클 수 있습니다.
Fast facts about hammer candlesticks:
망치 촛대에 대한 빠른 사실:
A hammer candle is the first step for a reversal signal during a downtrend.
해머 촛불은 하강기간의 반전 신호의 첫걸음이다.
Hammer candlesticks have a small body formed from the open and close and a long wick signaling a big intra-day reversal.
해머 촛대는 열린 부분과 닫힌 부분으로부터 형성된 작은 몸체와 긴 심지를 가지고 있어 하루 중 큰 반전을 예고하고 있다.
A hammer signals that a chart ran out of sellers at lower prices and buyers stepped in to bid prices back up near the open.
해머는 낮은 가격에 판매자가 바닥났고 구매자가 오픈가 근처로 다시 가격을 부르기 위해 개입했음을 나타낸다.
A move higher with the next candlestick confirms the reversal.
다음 촛대와 함께 더 높이 이동하면 반전이 확인된다.
Most traders buy the next day if their is a confirmation candle not on the hammer candle day.
대부분의 거래상들은 다음날이 망치 촛불이 아닌 확인 촛불이라면 사들인다.
The close can be a little lower or higher than the open.
폐쇄는 개방보다 약간 낮거나 높을 수 있다.
The lower wick is usually more than two times the range in comparison versus the open and closing price range.
낮은 심지는 보통 오픈 및 클로징 가격대를 대비하여 비교하면 두 배 이상이다
Hammer Candlestick examples:
해머 캔들스틱 예:

Chart courtesy of StockCharts.com
