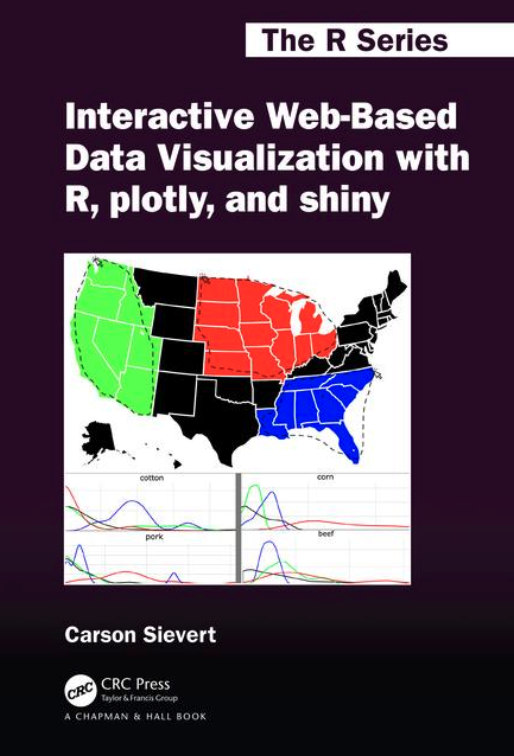
Interactive web-based data visualization with R, plotly, and shiny
"R을 사용한 대화 형 웹 기반 데이터 시각화, 음모 및 광택....
Welcome(환영해)
 This is the website for “Interactive web-based data visualization with R, plotly, and shiny”. In this book, you’ll gain insight and practical skills for creating interactive and dynamic web graphics for data analysis from
 R. It makes heavy use of plotly for rendering graphics, but you’ll also learn about other R packages that augment a data science workflow, such as the tidyverse and shiny. Along the way, you’ll gain insight into best practices for visualization of high-dimensional data, statistical graphics, and graphical perception. By mastering these concepts and tools, you’ll impress your colleagues with your ability to generate more informative, engaging, and repeatable interactive graphics using free software that you can share over email, export to pdf/png, and more.
An online version of this book, available at https://plotly-r.com, is free to use and is licensed under the Creative Commons Attribution-NonCommercial-NoDerivs 3.0 United States License. If you’d like a physical copy of the book, you can order it from CRC Press and Amazon. Both the print and online versions of the book are written in rmarkdown with bookdown and those source files are available at https://github.com/cpsievert/plotly_book. The online version will continue to evolve in between reprints of the physical book.
이 웹 사이트는 "R을 사용한 대화 형 웹 기반 데이터 시각화, 음모 및 광택"웹 사이트입니다. 이 책에서는 R의 데이터 분석을 위해 대화식 및 동적 웹 그래픽을 작성하는 데 필요한 통찰력과 실용 기술을 습득합니다. 그래픽 렌더링에 플롯을 많이 사용하지만 데이터 과학을 보강하는 다른 R 패키지에 대해서도 배웁니다. tidyverse와 같은 워크 플로우. 그 과정에서 고차원 데이터 시각화, 통계 그래픽 및 그래픽 인식에 대한 모범 사례에 대한 통찰력을 얻게됩니다. 이러한 개념과 도구를 습득함으로써 전자 메일을 통해 공유하고 pdf / png로 내보낼 수있는 무료 소프트웨어를 사용하여보다 유익하고 흥미롭고 반복 가능한 대화 형 그래픽을 생성 할 수있는 능력을 동료에게 알릴 수 있습니다.
https://plotly-r.com에있는이 책의 온라인 버전은 무료이며 Creative Commons Attribution-NonCommercial-NoDerivs 3.0 미국 라이센스에 따라 사용이 허가됩니다. 책의 실제 사본을 원하면 CRC Press와 Amazon에서 주문할 수 있습니다. 책의 인쇄본과 온라인 버전은 모두 북마크 다운과 함께 rmarkdown으로 작성되며 해당 소스 파일은 https://github.com/cpsievert/plotly_book에서 제공됩니다. 온라인 버전은 실제 책의 재 인쇄 사이에서 계속 발전 할 것입니다.
'거래기술에 관한 정보' 카테고리의 다른 글
| The First Principles for Profitable Trading:(수익성 거래의 첫 번째 원칙:) (0) | 2020.02.04 |
|---|---|
| How to Trade With the MACD Indicator:(MACD 표시기로 거래하는 방법: (0) | 2020.02.03 |
| A Guide To Understanding the Psychology of Trading:(거래 심리학을 이해하기 위한 지침 (0) | 2020.02.02 |
| Current Paul Tudor Jones Net Worth(현재 폴 튜더 존스 순가치) (0) | 2020.01.31 |
| My 20 Trading Truths:(나의 20가지 거래 진실:) (0) | 2020.01.30 |