How I Use the RSI Indicator(RSI 표시기 사용 방법)

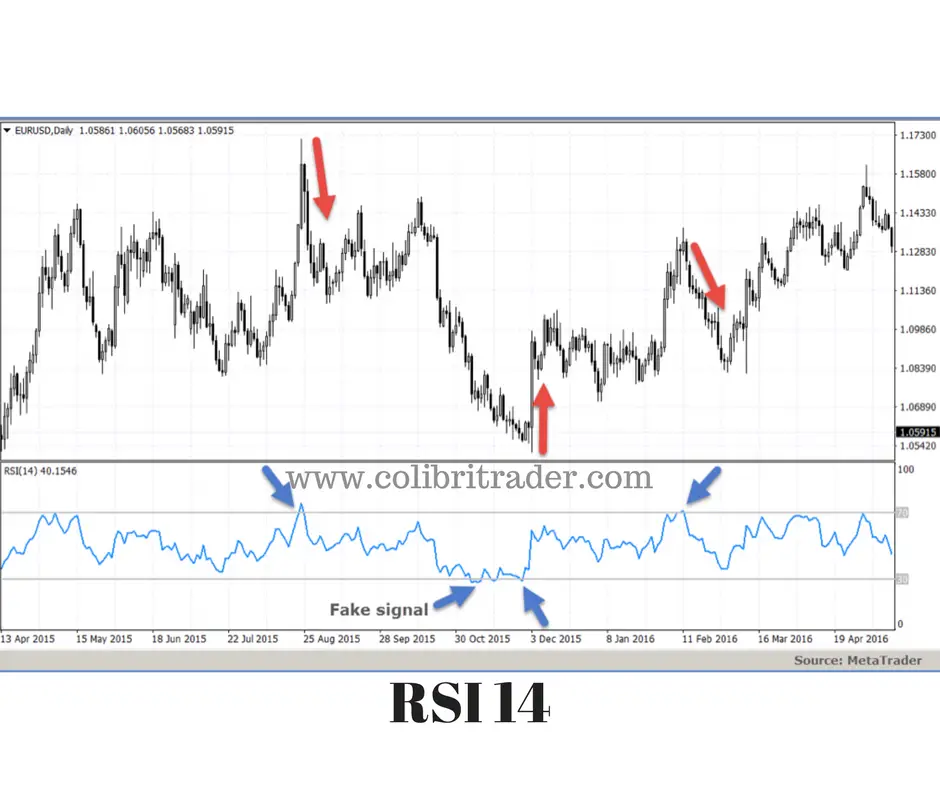
The RSI (Relative Strength Indicator) is a is a momentum oscillator that measures the speed and change of price movements. The RSI moves in a bounded range between zero and 100. I use the RSI on the (14) setting on the daily chart. The RSI is generally overbought when its reading is above 70 and oversold when it reads below 30. Signals can also be generated by looking for divergences between RSI and price action as one makes a higher high or lower low and the other doesn’t, parabolic break outs below 30 or above 70 on a closing basis and also centerline crossovers of price. RSI can also be used to identify the current trend of the market as price is generally above the 50 RSI in an uptrend and below the 50 RSI during a downtrend.
상대강도지표(RSI, Relative Strength Indicator)는 가격 이동 속도와 변화를 측정하는 모멘텀 오실레이터다. RSI는 0과 100 사이의 경계 범위에서 이동한다. 일일 차트의 (14) 설정에서 RSI를 사용한다. RSI는 일반적으로 판독치가 70 이상일 때 초과 구매하고 30 이하일 때는 초과 판매한다. 신호는 또한 RSI와 가격 조치 간의 차이를 확인함으로써 생성될 수 있다. 하나는 높거나 낮은 값을 만들고, 다른 하나는 그렇지 않기 때문이다. 포물선 이탈은 마감 기준으로 30 이하 또는 70 이상이고, 또한 중심선 교차 가격이다. 또한 RSI는 가격이 상승 추세에서 50 RSI를 상회하고 하강 추세에 50 RSI를 하회하는 경우 시장의 현재 추세를 파악하는 데 사용할 수 있다.
I like to use the RSI as an entry signal looking to buy the best stocks or index ETFs when price is near the 30 RSI reading. I prefer bounces at the 30 RSI to confirm support or breaks under and back over the 30 RSI to confirm it is near a bottom. The 50 RSI is usually a good reward target on a 30 RSI entry.
나는 가격이 30 RSI 수치 근처에 있을 때 최고의 주식이나 ETF를 사려는 진입 신호로 RSI를 사용하는 것을 좋아한다. 나는 30 RSI에서 지원 여부를 확인하기 위해 30 RSI에서 튕겨 나가거나, 거의 바닥을 쳤다는 것을 확인하기 위해 30 RSI보다 아래와 뒤로 꺾이는 것을 선호한다. 50 RSI는 보통 30 RSI 항목에서 좋은 보상 대상이다.
When I am long during up trends I look to exit and lock in profits when the 70 RSI starts to become resistance. If price breaks above and closes higher than the 70 RSI I will hold my long position as the potential of a parabolic uptrend increases.
나는 70 RSI가 저항이 되기 시작할 때, 오랫동안 상승 추세에 있을 때 빠져나와 이익을 잠그는 것을 본다. 만약 가격이 70 RSI보다 높게 상승하고 하락한다면, 나는 포물선 상승의 잠재력이 증가함에 따라 나의 오랜 위치를 유지할 것이다.
I look at the RSI chart as an oscillator that measures the risk/reward ratio. As it nears 30 the reward favors the buyer as a stock or index has moved too far down too fast and could be due(기일) for a bounce. At the 70 RSI the reward for long positions has started to diminish in most cases as a stock or index becomes overbought after having gone up too far and too fast. It is more probable that a stock can move from a 50 RSI to a 70 RSI than to move from a 70 RSI to a 90 RSI. Not impossible just less likely in the majority of cases.
나는 RSI 관리도를 위험/보상 비율을 측정하는 발진기로 본다. 주식이나 지수가 너무 빨리 하락하여 회복 기한이 될 수 있기 때문에 30이 가까워짐에 따라 보상은 매수자에게 유리하게 작용한다. 70 RSI에서는 주식이나 지수가 너무 많이 오르고 너무 빨리 오른 후 초과 매수됨에 따라 대부분의 경우 롱 포지션 대한 보상이 줄어들기 시작했다. 주식은 70 RSI에서 90 RSI로 이동하는 것보다 50 RSI에서 70 RSI로 이동할 가능성이 더 높다. 단지 대부분의 경우에 단지 덜 가능성이 있는 것은 아니다.
A market will spend most of its time inside the 30/70 RSI boundaries and rarely leaves this range. Combining the best stocks that are in demand with 30 RSI dips increases the odds of success as they are buyers wanting in(결핍한). Parabolic extended trends is what typically breaks the bounds of the RSI. The value zone is the 50 RSI and price tends to return to that area over time.
The RSI does not work perfectly every time as nothing does so you must still use proper position sizing to manage risk and stop out(중지하다) for a loss when price trends beyond its boundaries, but it is a great tool for quantifying the oversold and overbought parameters for items on your watch list.
시장은 대부분의 시간을 30/70 RSI 경계 안에서 보낼 것이며, 이 범위를 좀처럼 벗어나지 않을 것이다. 수요가 있는 최고의 주식을 30의 RSI 딥과 결합하면 구매자가 원하는 만큼 성공 확률이 높아진다. 포물선 확장 추세는 전형적으로 RSI의 경계를 무너뜨리는 것이다. 가치 영역은 50 RSI이며, 가격은 시간이 지남에 따라 그 영역으로 되돌아가는 경향이 있다.
RSI는 아무 것도 하지 않기 때문에 매번 완벽하게 작동하지 않으므로 적절한 위치 사이징을 사용하여 위험을 관리하고 가격 추세가 범위를 벗어날 때 손실을 방지해야 하지만, 그것은 당신의 시계 목록에 있는 품목에 대한 초과 판매 및 초과 구매 매개변수를 정량화하는 훌륭한 도구다.
'거래기술에 관한 정보' 카테고리의 다른 글
| 7 Habits of Highly Profitable Traders:(7 고수익 트레이더들의 습관:) (0) | 2019.09.19 |
|---|---|
| Ten Tips for using Moving Averages in Trading:(거래에서 이동 Averages를 사용하기 위한 10가지 팁:) (0) | 2019.09.18 |
| A Traders Quick Guide to Position Sizing:(포지션 사이징에 대한 트레이더 빠른 안내:) (0) | 2019.09.17 |
| How To Trade The Double Top Pattern(이중 상단 패턴의 트레이드 방법) (0) | 2019.09.16 |
| A Simple Trend Trading Strategy:(단순한 추세 거래 전략:) (0) | 2019.09.16 |