In technical analysis a Fibonacci retracement is a trading methodology for determining high probability support and resistance levels on a chart. It uses the Fibonacci sequence and that (게다가)is where its name comes from. A Fibonacci retracement uses the theory that price swings on charts will usually retrace and backfill a mathematical portion of a move, after this measured pullback the trend usually continues the move in the original direction.
기술 분석에서 피보나치 되돌림은 차트에서 높은 확률 지지 및 저항 수준을 결정하기 위한 거래 방법론이다. 그것은 피보나치 서열을 사용하며, 그것의 이름이 유래된 곳이다. 피보나치 되돌림은 차트에서 가격 변동이 일반적으로 이동의 수학적 부분을 재추적하고 다시 채운다는 이론을 사용한다 그 후 이 측정된 풀백 후 추세는 대개 원래 방향으로 이동을 계속한다
A probable Fibonacci retracement level is quantified by taking two distant price points on a chart and dividing the vertical distance by using the key Fibonacci ratios. 0% is the starting point for the measurement of the retracement, and 100% is a total reversal back to the starting point of the move. Fibonacci levels are identified by measuring moves from the starting point of support or resistance. Horizontal trend lines are drawn on the chart to identify the potential key support and resistance levels. The significant levels to look at are 61.8% 50%, 38.2%, and 23.6% for support or resistance.
가능성 있는 피보나치 되돌림 수준은 차트에서 두 개의 원거리 포인트를 취하여 키 피보나치 비율을 사용하여 수직 거리를 나누는 방식으로 정량화된다. 0%는 되돌림의 측정의 출발점이며, 100%는 이동의 출발점으로 되돌아가는 총 역전 이다. 피보나치 레벨은 지지대 또는 저항의 시작점에서 이동을 측정하여 식별한다. 차트에 수평 추세선을 그려 잠재적 키 지지대 및 저항 수준을 식별한다. 지켜봐야 할 의미있는 수준은 지지나 저항을 위한 61.8% 50%, 38.2%,이다.
A Fibonacci retracement is a very common technical tool that price action traders use to look for high probability price levels to enter trades, set stop losses in current trades, or set profit targets for winning trades.
피보나치 되돌림은 가격거래자들이 거래에 뛰어들기 위해 높은 가격수준을 찾고, 현재 거래에서 정지손실을 설정하거나, 매매에서 이익을 얻기 위해 이익목표를 설정하는 데 사용하는 매우 흔한 기술수단이다.
The concept of looking at key retracement levels at possible price extensions is a method not only used with Fibonacci but also with many other methods like Elliott Wave theory, Wolfe Waves, and Gartley patterns. After an up or down swing in price the new price support and resistance levels can be seen showing up at the key retracement levels in these methods.
가능한 가격 연장에서 주요 되돌림수준을 살펴보는 개념은 피보나치뿐만 아니라 엘리엇 웨이브 이론, 울프 웨이브, 가틀리 패턴과 같은 많은 다른 방법에서도 사용되는 방법이다. 가격 상승 또는 하락 후에 새로운 가격 지지 및 저항 수준이 이러한 방법의 주요 되돌림 수준에서 나타나는 것을 볼 수 있다.
While moving averages can change as price moves the Fibonacci retracement levels are set prices. They are targets on the chart that stay the same. This simplifies the identification of signals and creates price levels that can be acted on immediately when reached. These levels are key reaction points on a chart and can lead to a binary action for traders as the there is either a breakout in price or it is rejected and holds as support or resistance.
이동 평균은 가격 이동에 따라 변할 수 있지만, 피보나치 재전송 수준은 설정된 가격이다. 그들은 차트의 목표물들이 그대로 유지된다. 이것은 신호의 식별을 단순화하고 도달하면 즉시 조치될 수 있는 가격 수준을 만든다. 이러한 수준은 차트의 주요 반응 지점이며, 가격 이탈이 있거나 또는 가격 하락 또는 저항으로 거부 및 보유되기 때문에 트레이더들에게 2진법으로 이어질 수 있다.
The primary 0.618 Fibonacci retracement price level used by so many stock traders is approximately the ‘golden ratio’.
그렇게 많은 증권 거래자들이 사용하는 1차 0.618 피보나치 되돌림 가격 수준은 대략 '황금 비율'이다.
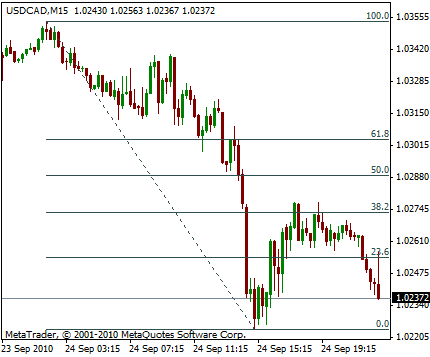
The below example shows Fibonacci retracement levels on the chart for the USD/CAD currency pair. In this example the price action retraced approximately 38.2% from a move down before continuing.
아래 예제는 USD/CAD 통화 쌍에 대한 차트의 피보나치 되돌림 수준을 보여준다. 이 예제에서 가격 조치는 계속하기 전에 하향 이동에서 약 38.2%를 되돌료 준다.
MetaQuotes Software Corp. / Copyrighted free use


