Wolfe Wave Patterns(울프 웨이브 패턴)
The Wolfe Wave chart pattern is created when price action makes 5 waves showing the key supply and demand areas that create a zone of support and resistance as buyers and sellers fight back and forth until a breakout of the expanding range occurs to a projected price extension.
울프 웨이브 차트 패턴은 가격조치가 예상 가격연장까지 확대범위의 이탈이 발생할 때까지 매수자와 매도자가 맞서면서 지지와 저항의 구역을 형성하는 핵심 수급지역을 보여주는 5개의 파장을 만들어 낼 때 생성된다.
Wolfe Wave patterns can be created on any timeframe and they are used for two things:
Wolfe Wave 패턴은 어느 시간대에나 생성될 수 있으며 두 가지 용도로 사용된다.
■Project the probability of the path of least resistance for the next price swing.
다음 가격 변동 시 최소 저항 경로 확률을 투영한다.
■Create an entry signal for increasing the odds of being in a position when it moves in one direction.
한 방향으로 이동할 때 위치에 있을 확률을 높이기 위한 입력 신호를 만드십시오.
Wolfe wave patterns can be either bullish or bearish depending on the direction of the breakout of resistance or support.
울프파 패턴은 저항이나 지지의 이탈 방향에 따라 강세 또는 약세 양상이 될 수 있다.
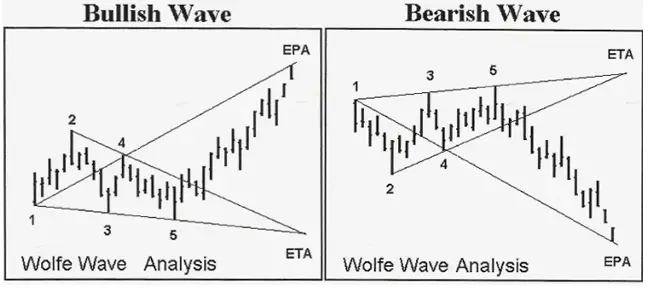
Bullish and Bearish Wolfe Wave Example (Image Source:www.insidefutures.com)
Bullish and Bearish Wolfe Wave 예(이미지 출처:www.insidefutures.com)
These chart patterns create breakout signals and are meant to capture trends in price in the direction of the breakout.
이러한 차트 패턴은 브레이크아웃 신호를 생성하며 브레이크아웃 방향으로 가격 추세를 포착하기 위한 것이다.
Price channels in an uptrend can create a Bearish Wolfe wave and price channels in a downtrend can create a bullish Wolfe Wave and a sideways range happens when price is moving sideways and it can be neutral and break in either direction.
상승세에 있는 가격채널은 베어리쉬 울프 파동을 만들 수 있고 하락세에 있는 가격채널은 강세 울프 파동을 만들 수 있으며 가격이 횡보할 때 횡보 범위가 발생하며 중립적이고 어느 방향으로든 돌파할 수 있다.
The bullish Wolfe Wave is a type of the falling wedge chart pattern. The bearish Wolfe wave is a type of the rising wedge chart pattern. It is where the breakout of the support or resistance happens that determines the sentiment. The Wolf Wave is similar to an Elliott Wave as it attempts to project the magnitude of the move of a wave.
강세 울프 웨이브는 하강 웨지 차트 패턴의 일종이다. 약체 울프 파동은 상승 웨지 차트 패턴의 일종이다. 정서를 결정하는 것은 지지층의 이탈이나 저항이 일어나는 곳이다. Wolf Wave는 Elliot Wave의 움직임의 크기를 투영하려고 시도하기 때문에 Wolf Wave는 Elliot Wave와 유사하다.
For a chart pattern to qualify as a Wolfe Wave pattern it must have the following dynamics in price action:
도표 패턴이 Wolfe Wave 패턴으로 적합하려면 다음과 같은 가격 작용 역학을 가져야 한다.
The 3 and 4 waves must remain inside the channel made by the 1 and 2 waves.
3, 4 파도는 1, 2 파동이 만든 채널 안에 남아 있어야 한다.
The 1 and 2 waves are very similar is size to the 3 and 4 waves and are symmetrical.
1파와 2파는 3파와 4파의 크기와 매우 유사하며 대칭적이다.
Wave 4 is inside the price channel made by the 1 and 2 waves.
웨이브4는 1,2파가 만든 가격채널 안에 있다.
There is consistent time between the creation of all the different price waves,
모든 다른 가격 파동의 생성 사이에는 일관된 시간이 있다.
Wave 5 is greater than the trendline made by the 1 and 3 waves and is the last key support or resistance area before a reversal in the opposite direction.
웨이브 5는 1·3파가 만든 트렌드라인보다 크며 반대 방향으로 반전하기 전 마지막 키 지지대 또는 저항 영역이다.
Entries can be made either projecting a reversal from support or resistance at Wave 5 or entries can be made in the direction of the breakout of the trendline created by waves 2 and 4. There is a better probability of success on the 2/4 breakout than the early entry at the first wave 5 level looking for the reversal.
진입은 5단계에서 지지 또는 저항의 반전을 반영하거나 2단계와 4단계에 의해 생성된 추세선의 이탈 방향으로 할 수 있다. 반전을 노리는 1차 파동 5단계의 초반 진입보다 2/4 브레이크에서 성공할 확률이 더 높다.
This pattern is not predictive it is simply meant to show a high probability momentum entry signal and to create a good possible swing trade as buyers or sellers push price action to break out of a trading wedge and move to a projected price target.
이 패턴은 구매자나 판매자가 거래 쐐기를 벗어나 예상 가격 목표치로 이동하기 위해 가격 행동을 추진함에 따라 가능한 좋은 스윙 트레이드를 만들고 확률이 높은 진입모멘트를 보이기 위한 것이다라는 단순한 단정되는 것이 아니다
.
'거래기술에 관한 정보' 카테고리의 다른 글
| Fibonacci Retracement Explained(피보나치 재추적 설명) (0) | 2020.05.05 |
|---|---|
| Common Mistakes in Technical Analysis:(기술 분석의 일반적인 오류:) (0) | 2020.05.05 |
| How to Download Historical Stock Data(과거 주식 데이터를 다운로드하는 방법) (0) | 2020.05.03 |
| Best and Worst Months for the Stock Market(주식시장에 가장 좋은 달과 최악의 달) (0) | 2020.05.02 |
| Things That a Backtest Does Not Show:(백테스트가 보여주지 않는 것들:) (0) | 2020.05.02 |