Long Legged Doji Candlestick Patterns Explained(긴 다리 도지 촛대 패턴 설명)
Posted By: Steve Burnson:
The long-legged doji candlestick pattern has both long upper and lower shadows (wicks) and generally has a closing price near where it opened in the time frame of the candle. The long-legged doji candlestick can signal extreme indecision in the current market with a large trading range but no winner between buyer and sellers to move price in one direction.
다리가 긴 도지 촛대 무늬는 상하로 긴 그림자(윅)를 둘 다 가지고 있으며 일반적으로 촛불의 시간 틀에서 열린 곳 근처에 종가가 있다. 다리가 긴 도지 촛대는 거래 범위는 크지만 구매자와 판매자 사이에 가격을 한 방향으로 움직일 승자가 없는 현 시장에서 극단적인 우유부단함을 나타낼 수 있다.

Long-legged Doji image via Wikipedia
위키피디아를 통한 다리가 긴 도지 이미지
This indecision candle can be seen by investors as a signal that there is a high probability of an end to the current trend as traders and investors were unable to keep the price moving in one direction.
이런 우유부단한 촛불은 거래자와 투자자가 가격을 한 방향으로 계속 움직일 수 없어 현 추세가 종식될 가능성이 높다는 신호로 투자자들이 볼 수 있다.
In an uptrending market a long-legged doji can warn of an impending reversal to the downside. In a downtrending market a long-legged doji can signal a potential reversal to the upside.
상승장에서 다리가 긴 도지는 하방으로의 반전이 임박했음을 경고할 수 있다. 하락장에서 다리가 긴 도지는 상승세로 반전될 가능성을 예고할 수 있다.
Long-legged doji candles can also signal the end of a trend but the beginning of a sideways range bound market as neither buyers or sellers can get the upper hand in bidding a market up or down. (Buyers and sellers are always equal in trading action it is the price that changes and moves based on current bid/ask spreads agreeing to make a trade).
다리가 긴 도지 양초는 또한 구매자나 판매자 둘 다 시장의 상·하향 입찰에서 우위를 점할 수 없기 때문에 유행의 종말이지만 횡방향으로 묶인 시장의 시작을 신호할 수 있다. (매수자와 판매자는 거래 행위에서 항상 같으며 거래에 동의하는 현재의 입찰/매도 스프레드에 근거하여 변화하고 움직이는 가격이다.)
Long-legged doji have very long upper and lower wicks and a tiny body with the opening and closing price almost the same.
다리가 긴 도지는 상하의 윅이 매우 길고, 개찰가와 종가가 거의 같은 작은 몸을 가지고 있다.
This candle pattern signals indecision.
이 양초 패턴은 우유부단함을 나타낸다.
It can be a reversal signal during strong trends.
강세 때 역전 신호가 될 수 있다.
It can also signal a new range bound market.
그것은 또한 새로운 레인지 바운드 시장의 신호를 보낼 수 있다.
Many traders will wait for the next candle on the chart after the long-legged doji to confirm a reversal as it creates a higher probability of success than signaling off(내보내다) just one candle.
많은 트레이더는 긴 다리가있는 도지 이후 차트에서 다음 캔들에서 반전을 확인하기를 기다릴 것입니다. 이는 하나의 캔들에 신호를 보내는 것보다 성공 확률이 더 높기 때문입니다.
It does not always work and can just be a news driven volatility expansion before the existing trend resumes.
항상 작동하는 것은 아니며 기존 추세가 재개되기 전에 뉴스 중심의 변동성 확장 일 수 있습니다.
The odds of it being a reversal signal are higher when the long-legged doji candle occurs in an uptrend near an overbought reading or it appears in a downtrend near oversold reading.
반전 신호일 가능성은 긴 다리가 있는 도지 캔들이 과매수 근처의 상승 추세에서 발생하거나 하락 추세 및 과매도 근처에서 나타날 때 더 높습니다.
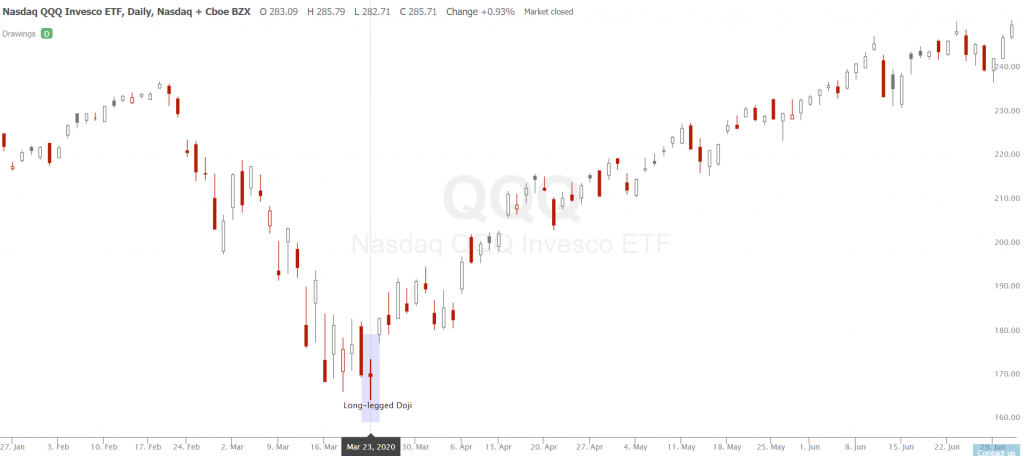
Chart courtesy of TrendSpider.com
'거래기술에 관한 정보' 카테고리의 다른 글
| What Is A Candlestick?(촛대란 무엇인가?) (0) | 2020.10.13 |
|---|---|
| Long-Legged Doji(긴 다리 도지) (0) | 2020.10.12 |
| The Best Rich Dad, Poor Dad Quotes:(최고의 부자 아빠, 가난한 아빠의 인용:) (0) | 2020.10.12 |
| Bullish candle stick and Berish Candale stick(불리쉬 초스틱과 베어리쉬 캔들 스틱입니다) (0) | 2020.10.11 |
| Munehisa Homma: Legendary Price Action Trader(무네히사 옴마: 레전드 프라이스 액션 트레이더) (0) | 2020.10.11 |