Parabolic SAR Explained(포물선 SAR 설명)
Posted By: Steve Burnson:
The Parabolic SAR (stop and reverse) indicator is a technical trading tool that quantifies both trends and price reversals on a chart and can be used as a stop loss, trailing stop, or entry signal. The Parabolic SAR indicator was created as a trend following tool that allowed winning trades to run until they stopped and reversed maximizing the gain in trend.
포물선 SAR(정지 및 역) 표시기는 차트에서 추세와 가격 역전을 모두 정량화하는 기술 거래 도구로 정지 손실, 추종 정지 또는 진입 신호로 사용할 수 있다. 파라볼릭 SAR 지표는 승자 거래가 중단되고 추세의 이득을 극대화할 때까지 실행되도록 허용하는 추종 도구로 만들어졌습니다.
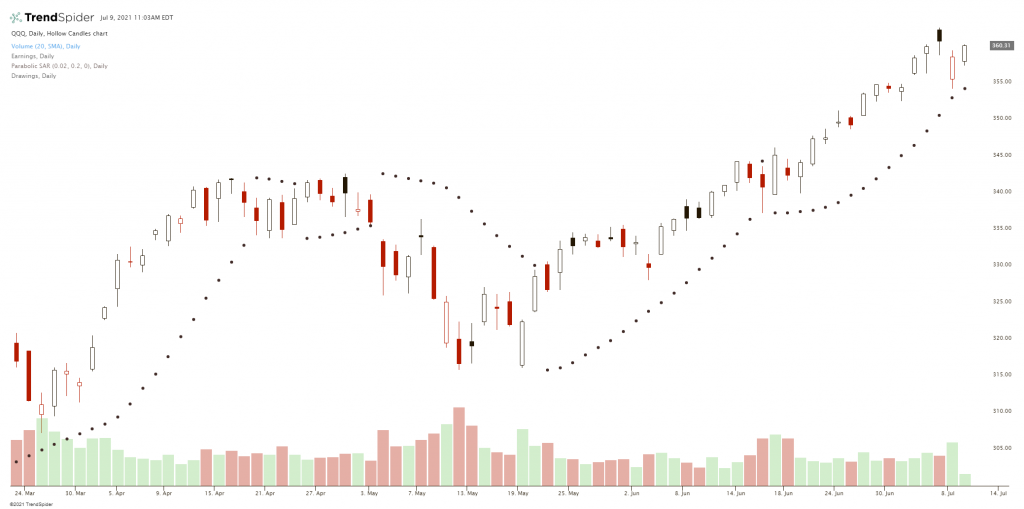
This technical indicator creates a parabola on a chart using small dots above or below the price action. If below the price it is bullish showing an uptrend and shows the support area where it would signal a trend reversal. When price falls beneath the dots on the indicator it signals a stop loss for a new trade or a trailing stop for a winning trade. A trader should be thinking long when price is above the dots and short or in cash when price is below the dots.
이 기술 지표는 가격 조치 위 또는 아래에 작은 점을 사용하여 차트에 포물선을 만듭니다. 가격 아래에 있으면 상승 추세를 보여주는 강세이며 추세 반전을 알리는 지지 영역을 보여줍니다. 가격이 표시기의 점 아래로 떨어지면 새로운 거래에 대한 손절매 또는 성공적인 거래에 대한 추적 중지를 나타냅니다. 거래자는 가격이 점 위에 있을 때 길게 생각하고 가격이 점보다 낮을 때 매도 또는 현금으로 생각해야 합니다.
The parabola dots show the overall trend on a chart based in its curve and relation to the price action above or below it. It can act as resistance for price above or support for price below. It is both a momentum and trend indicator as it can visually show an uptrend when curving up, a downtrend when curving down, and a trading range when going sideways. Traders can see a price break (하락)above the upper parabola as a momentum buy signal or a buy to cover(다루다) short(매도) signal. The Parabolic SAR can be used in the context of other indicators like the RSI along with candlestick patterns to get a complete view of the chart and if the PSAR signals present a good risk/reward ratio when they trigger.
포물선 점들은 곡선과 그 위나 아래의 가격 행동과의 관계를 바탕으로 한 차트의 전반적인 추세를 보여준다. 그것은 위의 가격에 대한 저항이나 아래의 가격에 대한 지원 역할을 할 수 있다. 곡선을 위로 그리면 상승세, 곡선을 아래로 그리면 하강세, 옆으로 갈 때는 거래범위를 시각적으로 보여줄 수 있기 때문에 모멘텀과 트렌드 지표다. 트레이더들은 모멘텀 구매 신호나 짧은 매도 신호를 커버하기 위한 구매로 상부 포물선 위의 가격 하락을 볼 수 있다. 포물선 SAR은 촛대 패턴과 함께 RSI와 같은 다른 지표의 맥락에서 차트를 완전히 볼 수 있으며 PSAR 신호가 트리거할 때 좋은 위험 / 보상 비율을 나타내는 경우 사용할 수 있습니다.
'거래기술에 관한 정보' 카테고리의 다른 글
| Supertrend Indicator Explained(슈퍼트렌드 지표 설명) (0) | 2021.07.12 |
|---|---|
| Diamond Pattern Explained(다이아몬드 패턴 설명) (0) | 2021.07.12 |
| Alligator Indicator(악어의 표시기) (0) | 2021.07.11 |
| Parabolic Definition(포물선의 정의) (0) | 2021.07.11 |
| Position Trading Explained(포지션 거래의 설명 ) (0) | 2021.07.09 |