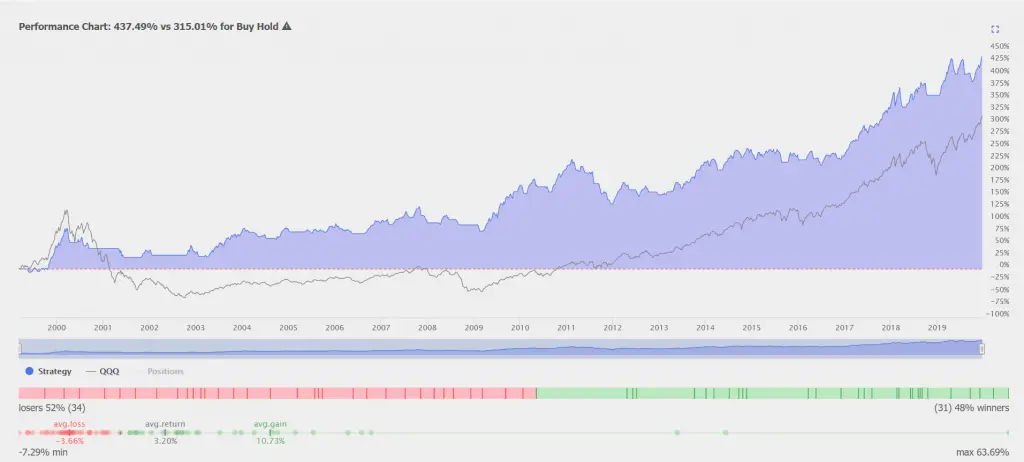
Moving averages are technical trading indicators for capturing trends. This post shows the backtesting data and system equity curve versus buy and hold using TrendSpider.co
이동 평균은 추세를 포착하기 위한 기술적 거래 지표다. 이 게시물은 TrendSpider.com을 사용하여 구입하고 보유하는 것과 비교하여 백테스트 데이터와 시스템 자본 곡선을 보여준다.
m. 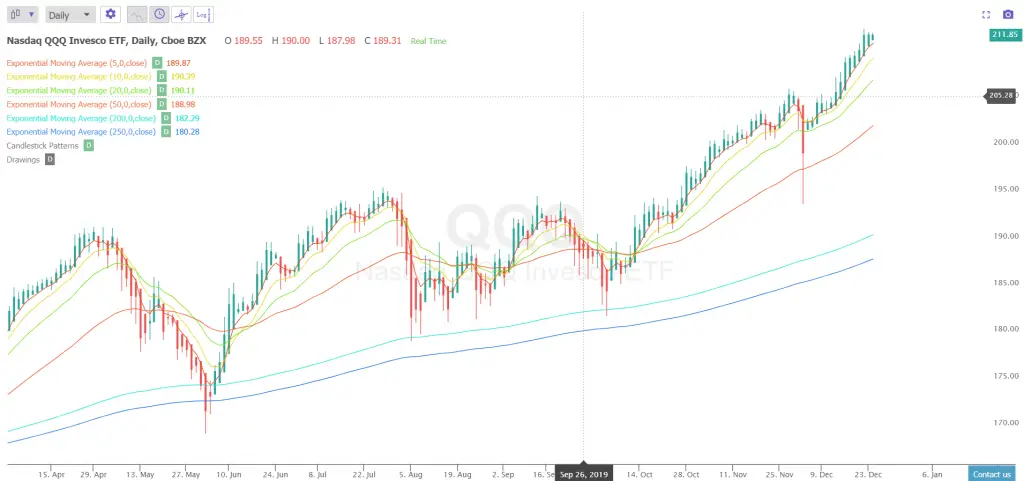
Chart Courtesy of TrendSpider.com
TrendSpider.com의 차트 커티시
This is the backtest based on buying $QQQ when the 5 day EMA crosses and closes over the 20 day EMA and then selling when the 5 day EMA closes back under the 20 day EMA:
이는 5일 EMA가 20일 동안 EMA를 교차 및 초과하여 종료할 때 $QQQ를 구매한 후 5일 EMA가 20일 EMA에 밑에서 다시 닫힐 때 판매에 기반한 백테스트다.
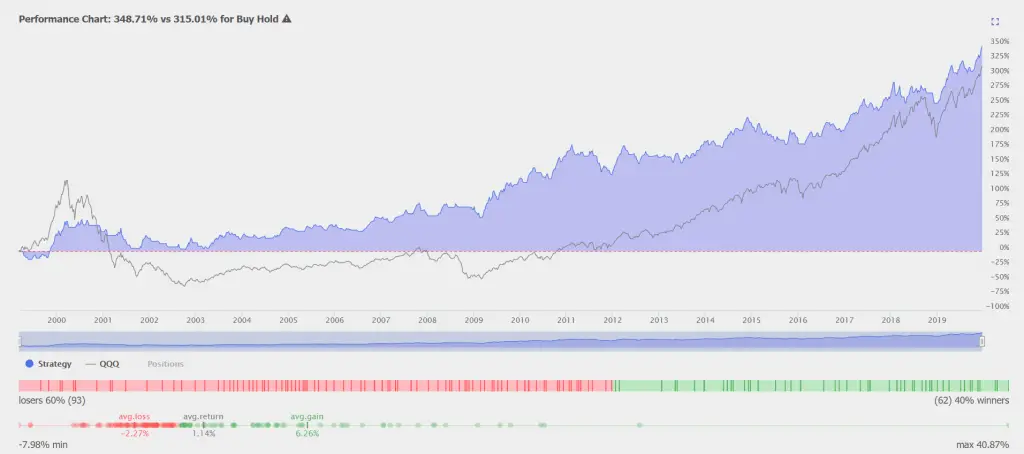
Chart Courtesy of TrendSpider.com
TrendSpider.com의 차트 커티시
This is the backtest based on buying $QQQ when the 10 day EMA crosses and closes over the 50 day EMA and then selling when the 10 day EMA closes back under the 50 day EMA:
이는 10일 동안 EMA(단기추세)가 50일 동안 교차 및 초과하여 마감될 때 $QQQ를 구매한 후, 10일 EMA(단기추세)가 50일 EMA에 밑애소 다시 닫힐 때 판매에 기반한 백테스트다.
This is the backtest based on buying $QQQ when price closes over the 200 day EMA and then selling when price closes back under the 200 day EMA:
이는 200일 동안 EMA(상향 마지막 스탠스와 하향 마지막 스탠스)을 초과하여 가격이 마감될 때 $QQQ를 구매한 후 200일 EMA(상향 마지막 스탠스와 하향마지막 스탠스) 이하에 따라 가격이 다시 마감될 때 판매한 것에 근거한 백테스트다.
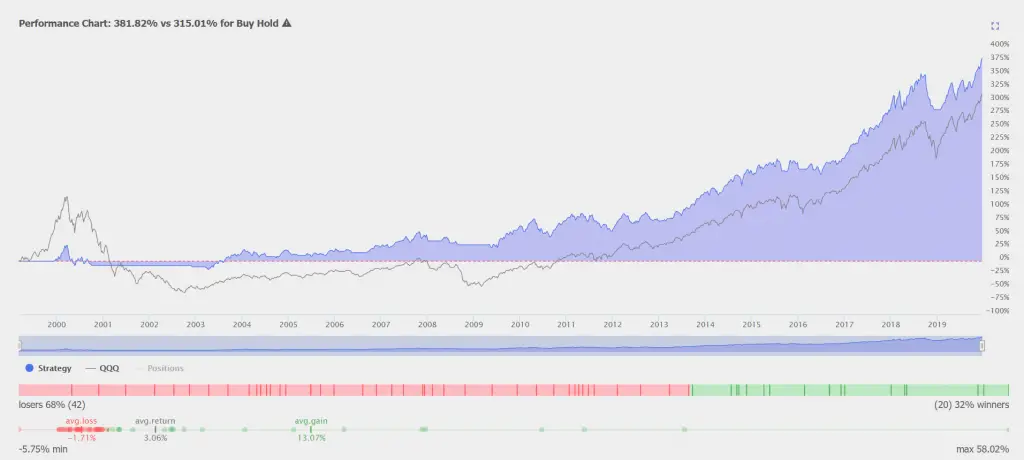
Chart Courtesy of TrendSpider.com
TrendSpider.com의 차트 커티시
This is the backtest based on buying $QQQ when price closes over the 250 day EMA and then selling when price closes back under the 250 day EMA:
250일 동안(가치영역)을 초과하여 가격이 마감될 때 $QQQ를 구매한 후 250일 EMA(가치영역) 밑에서 가격이 다시 마감될 때 판매한 것에 근거한 백테스트다.
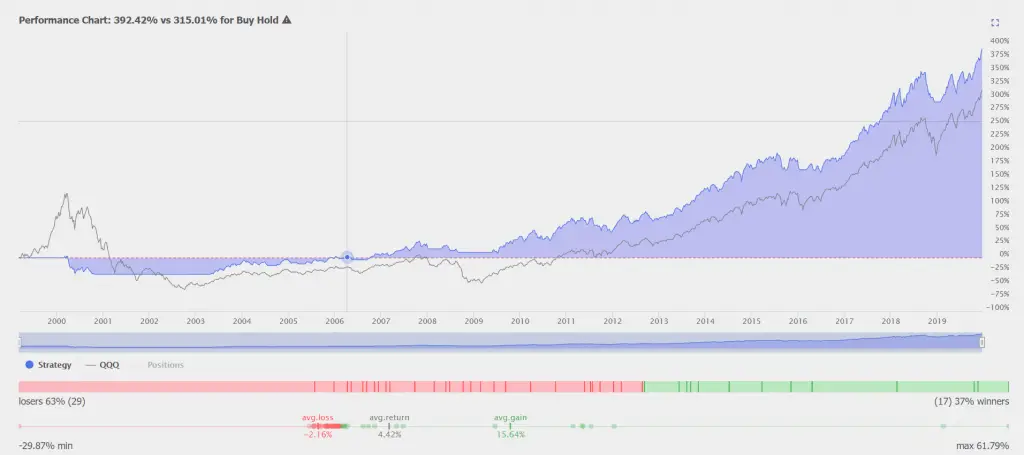
Chart Courtesy of TrendSpider.com
TrendSpider.com의 차트 커티시
