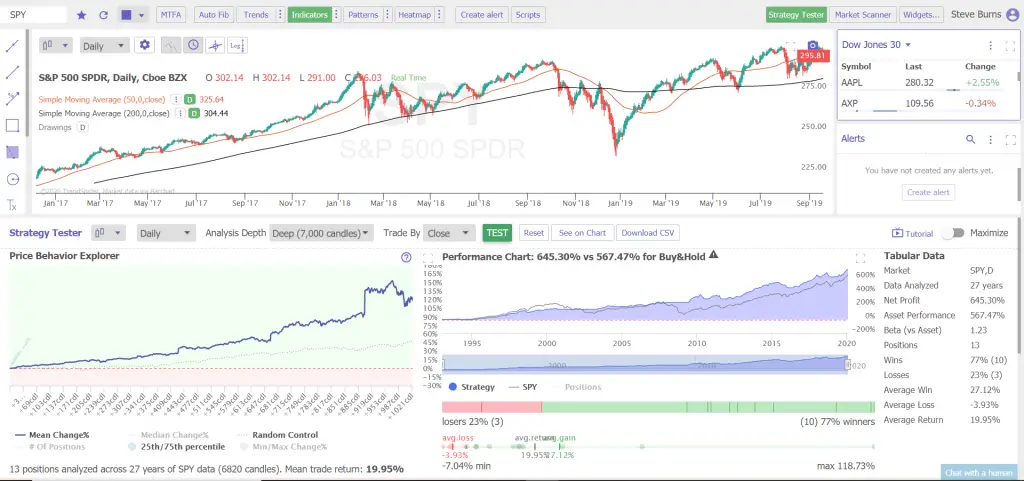
One example of a simple long term trend following system is the ‘Golden Cross’. This is the most popular and famous bullish moving average crossover entry signal along with its inverse ‘Death Cross’ bearish exit or short selling signal.
시스템에 이은 단순한 장기 추세의 한 예가 '황금십자'이다. 이것은 그것의 역방향 '죽음의 십자가' 약한 출구 또는 짧은 판매 신호와 함께 가장 인기 있고 유명한 이동 평균 크로스오버 진입 신호다.
The Golden Cross happens when the 50 day simple moving average crosses over the 200 day simple moving average crossover and stays above until the end of the day. This signal has you go long when the 50 day simple moving averages closes above the 200 day simple moving average and takes you back to cash when the 50 day SMA closes back under the 200 day SMA signaling the Death Cross.
골든 크로스는 50일 간의 단순 이동 평균이 200일 간 이동 평균을 초과하여 하루의 끝까지 위에 있을 때 발생한다. 이 신호는 50일 단순 이동 평균이 200일 단순 이동 평균 이상으로 마감될 때 길게 가고, 50일 SMA가 죽음의 십자가를 알리는 200일 SMA에 따라 다시 닫힐 때 다시 현금으로 돌아간다.
This strategy is best compared to buy and hold investing using the SPY ETF for the backtest and presents a simple alternate that creates more returns than buy and hold investing by going to cash during extended bear markets and crashes. This is a very long term strategy and closer to trend following or investing than swing trading or day trading.
이 전략은 백테스트를 위해 SPY ETF를 사용하여 투자하고 보유하는 것과 비교하는 것이 가장 좋으며, 장기 약세시장과 폭락시 현금화함으로써 투자를 구매하고 보유하는 것보다 더 많은 수익을 창출하는 간단한 대안을 제시한다. 이는 매우 장기적인 전략이며 스윙 트레이딩이나 데이 트레이딩보다 후속 또는 투자에 더 가까운 추세다.
Historically the cash signal decreases the drawdown in capital dramatically. This moving average strategy stays long in bull markets but not during sustained downtrends. It also filters out much of the noise in price action and does not create many false signals. The weakness is that it is slow to react to quick market crashes.
역사적으로 현금 신호는 자본의 감소를 극적으로 감소시킨다. 이러한 이동 평균 전략은 강세 시장에서 오래 유지되지만 지속적인 하락기에는 유지되지 않는다. 그것은 또한 가격 행동의 소음을 많이 걸러내고 많은 거짓 신호를 만들지 않는다. 약점은 빠른 시장 붕괴에 반응하는 것이 느리다는 것이다.
This is the backtest data in $SPY from 1993-2019 and from $QQQ from 1999-2019.
The $SPY golden crossover signal average return was +19.95% per trade, total return over the full backtest since 1993 was +645.30% versus the buy and hold return of 567.47%. The big out performance(우수성능) started after buy and hold took the substantial draw down in 2008 that the crossover(교차) avoided. It also outperformed coming out of the 2002 sell off. Risk management is one of the biggest strengths of this signal.
이는 1993-2019 년 및 1999-2019 년 $ QQQ으로부터 온 $ SPY 백 테스트 데이터입니다.
SPY 골든 크로스 오버 신호 평균 수익률은 거래 당 + 19.95 %였으며, 1993 년 이후 전체 백 테스트에서 발생한 총 수익률은 매수 및 유지 수익률 567.47에 비해 645.30 %입니다 ,큰 우수한 성능은 매입보유가 교차가 피해진 2008 년에 실제적인 하락이 있었던 후에 시작되었다. 또한 2002 년 매각에서 나오는 것을 가한 성능이었다. 리스크 관리는 이 신호의 가장 큰 장점 중 하나입니다.


Backtest Data Courtesy of TrendSpider.com