A death cross is one of the most popular bearish moving average crossovers in the trading world. It is a bearish signal that means the stock market is in a downtrend and could go much lower when the 50-day simple moving average crosses under the 200-day simple moving average from above. It shows a loss of price momentum to the upside and that the current path of least resistance is to the downside.
데스 크로스는 거래 세계에서 가장 인기있는 약세 이동 평균 크로스 오버 중 하나입니다. 약세 신호는 주식 시장이 하락세에 있고 50 일 단순 이동 평균이 위에서 200 일 단순 이동 평균 아래로 교차 할 때 훨씬 낮아질 수 있음을 의미합니다. 그것은 상승 모멘텀의 상실 모멘텀 손실을 보여주고 최소 저항의 현재 경로는 하방으로 향함을 보여준다
It is a longer term trend following type of signals and is used by some to sell their long positions due to the risk of more losses, sell short, or use it as all overall bearish market indicator.
신호 종류에 따른 장기적 추세이거나 , 일부에서는 더 많은 손실의 위험으로 인해 장기적 지위를 매각하는데 사용하거나 , 단기적으로 매도하는데 사용 ,또는 전체 약세 시장 지표로 사용한다.
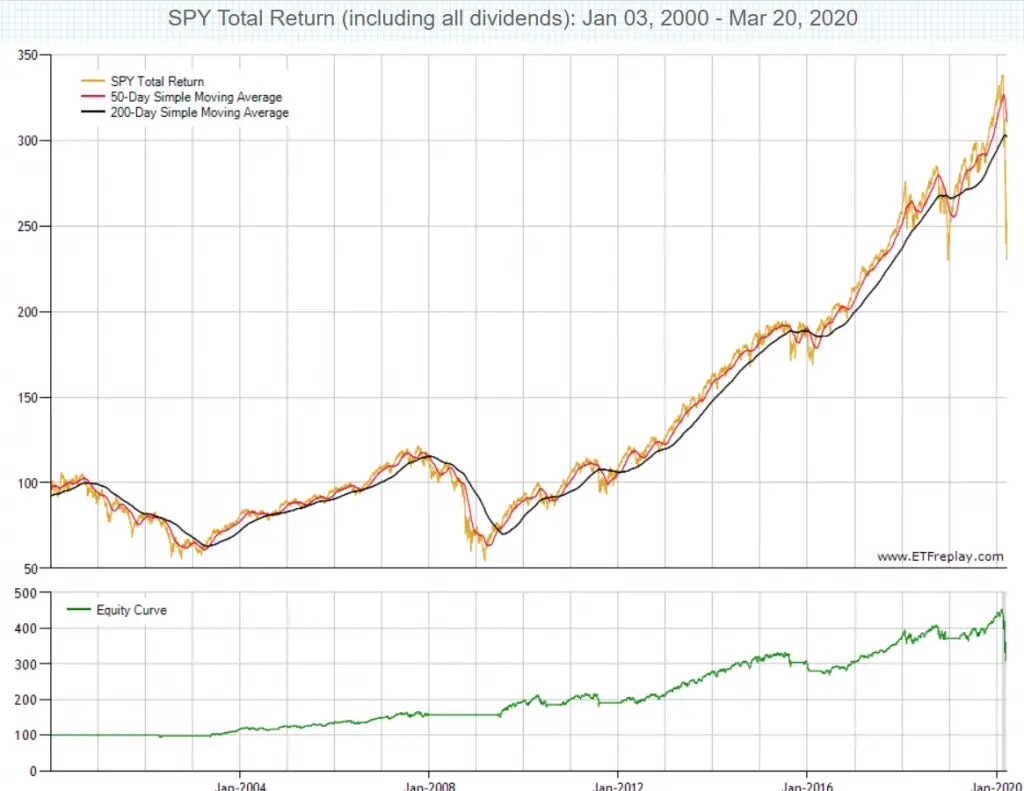
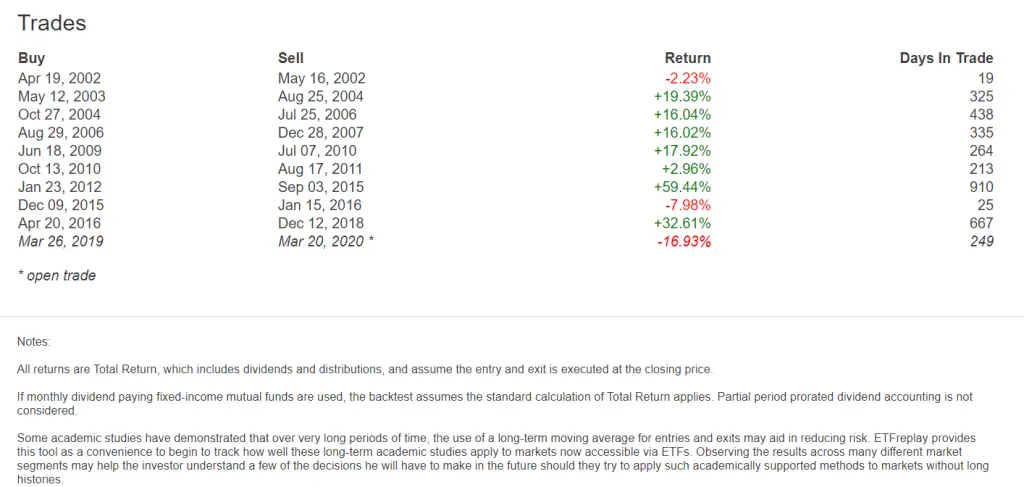
Here are the time periods over the last 20 years where the $SPY ETF was under a death cross:
지난 20년 동안 $SPY ETF가 죽음의 십자가 아래에 있었던 기간은 다음과 같다.
May 16, 2002 to May 11, 2003 (2002년 5월 16일 ~ 2003년 5월 11일)
August 25, 2004 to October 26, 2004 (2004년 8월 25일 ~ 2004년 10월 26일)
July 25, 2006 to August 28, 2006 ( 2006년 7월 25일 ~ 2006년 8월 28일)
December 28, 2007 to June 17, 2009 (2007년 12월 28일 ~ 2009년 6월 17일)
July 07, 2010 to October 12, 2010 ( 2010년 7월 7일 ~ 2010년 10월 12일)
August 17, 2011 to January 23, 2012 (2011년 8월 17일 ~ 2012년 1월 23일)
September 3, 2015 to December 9, 2015 (2015년 9월 3일 ~ 2015년 12월 9일)
January 15, 2016 to April 20, 2016 (2016년 1월 15일 ~ 2016년 4월 20일 )
December 12, 2018 to March 25, 2019 (2018년 12월 12일 ~ 2019년 3월 25일)
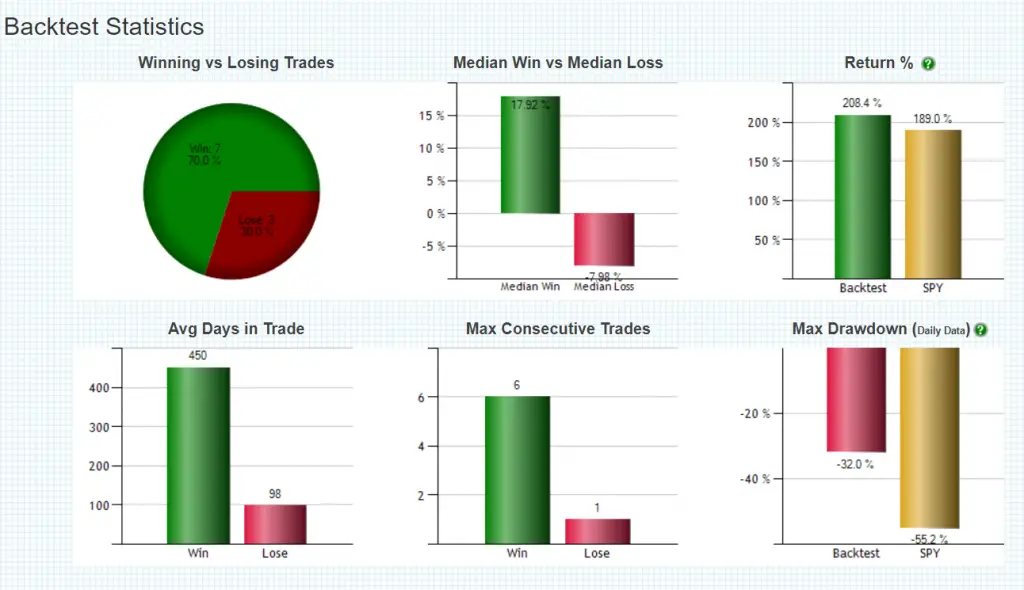
The below backtesting data shows a chart with the crossover entry signals and cross under exit signals, these statistics are for using it as a signal to go to cash, and the time periods you would be long if used it as a trend filter going long when the 50 day simple moving average crossed back over the 200 day simple moving average and had the inverse ‘golden cross’.
아래 의 백테스팅 데이터는 크로스 오버 입력 신호와 출구 신호 아래 교차 차트를 보여줍니다, 이러한 통계는 현금으로 이동하는 신호로 사용하기 위한 것이며 그리고 기간은 당신이 50 일 단순이동 평균이 200 일 단순 이동 평균 위에서 다시 교차를 하고 역 '황금 십자가'를 가졌을 때 장기로 가는 필터 추세로서 사용한다면 길게 되는 것이다


Data and charts courtesy of ETFreplay.com