Simple Trend Indicators(간단한 추세 표시기)
A market trend is the direction that prices are moving in for a specific timeframe. A market can move in an uptrend, a downtrend, and other times just go sideways inside a price range.
Here are simple trend indicators to identify a trend in your trading timeframe.
시장 동향은 특정 기간 동안 물가가 움직이는 방향이다. 시장은 상승세, 하락세로 움직일 수 있고, 다른 때는 가격대 안에서 옆으로 갈 수 있다.
여기 당신의 거래 기간 중 추세를 파악하기 위한 간단한 추세 지표가 있다.
Uptrend indicators:
업트랜드 표시기:
Higher highs and higher lows in your timeframe.
타임프레임 안에 더 높은 고도와 더 높은 저도.
A breakout to all time highs in price.
. 사상 최고가 돌파
A breakout to 52-week highs in price.
.가격 52주 최고치 돌파
A bullish MACD crossover.
4.강 MACD 크로스오버.
Price remaining above a moving average in your timeframe.
시간 내에 이동 평균 이상 유지되는 가격.
A bullish moving average crossover when a shorter term moving average crosses above a longer term moving average.
단기 이동 평균이 장기 이동 평균 이상일 때 강세 이동 평균 교차
.
Downtrend indicators:
다운트랜드 표시기
Lower highs and lower lows in your timeframe.
시간프레임에 낮은 고도와 낮은 저도
A breakdown to all time lows in price.
전시간 가격하락으로 분류.
A breakout to 52-week lows in price.
가격 52주 최저치로 돌파
A bearish MACD cross under.
곰 같은 MACD 크로스가 밑에 있다.
Price remaining below a moving average in your timeframe.
시간 내에 이동 평균 이하로 유지되는 가격.
A bearish moving average crossunder when a shorter term moving average crosses under a longer term moving average.
짧은 기간 이동 평균이 더 긴 기간이동 평균 이하로 교차할 때 약한 이동 평균 교차.
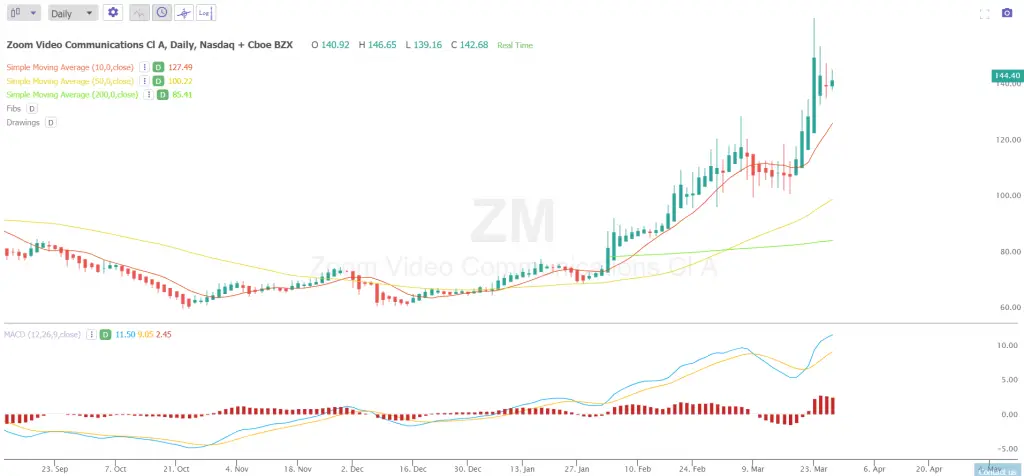
Example of an uptrend in price:
가격의 상향추세의 일례

Chart Courtesy of TrendSpider.com
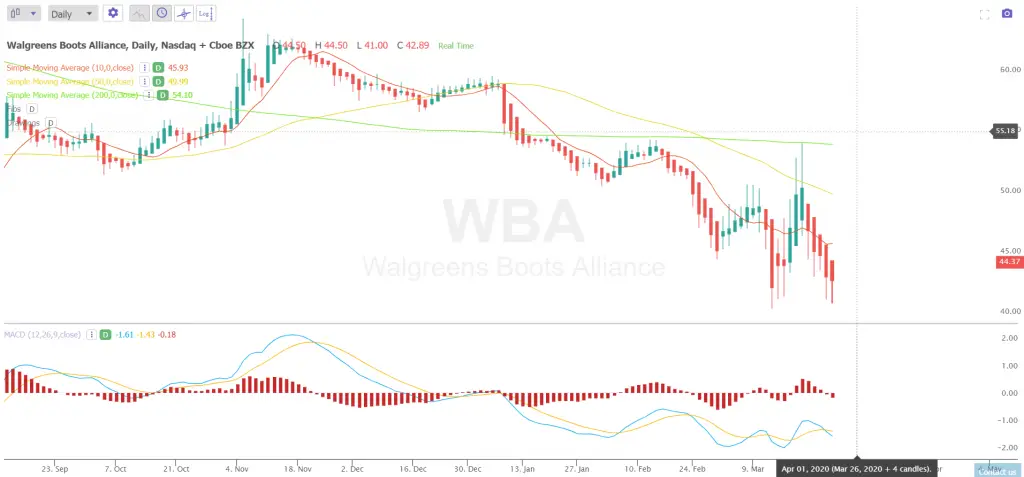
Example of a downtrend in price:
가격의 하향추세의 일례

Chart Courtesy of TrendSpider.com
'거래기술에 관한 정보' 카테고리의 다른 글
| Max Pain in Options (설명된 옵션의 최대 고통) (0) | 2020.03.28 |
|---|---|
| Falling Wedge Pattern Explained(하강 웨지 패턴 설명:) (0) | 2020.03.28 |
| 10 Bad Habits of Unprofitable Traders:(수익성이 없는 트레이더의 10가지 나쁜 습관:) (0) | 2020.03.27 |
| 10 Ways To Protect Yourself in Trading: (0) | 2020.03.26 |
| What is a Bull Trap(황소함정이란) (0) | 2020.03.26 |