Buy and hold investing on the S&P 500 index with a low cost mutual fund is a top performing system first made popular by Jack Bogle. Warren Buffett also recommends this strategy as a way to beat the majority of mutual fund managers and hedge fund managers. Most financial advisers recommend this buy and hold strategy if a client is going to hold their investments for at least ten years as the majority of ten year periods are profitable. The downside(단점) is the pain that has to be endured during bear market drawdowns and market crashes also when you enter into the market, how you accumulate your position over time, and when you need to start taking your money out. A buy and hold investor that started in March 2000 or January 2008 will not think it is as great a system as someone that started in March of 2003 or March of 2009. Could there be a better way?
저비용 뮤추얼 펀드로 S&P 500지수에 대한 매수 및 투자 유지는 잭 보글이 처음 만든 최고의 실적 시스템이다. 워렌 버핏은 또한 이 전략을 대부분의 뮤추얼 펀드 매니저들과 헤지 펀드 매니저들을 이기기 위한 방법으로 추천한다. 대부분의 금융 고문들은 고객이 10년 기간의 대다수가 이익이 되기 때문에 최소 10년 동안 투자를 보유할 경우 이러한 매수 및 보유 전략을 추천한다. 단점은 당신이 시장에 뛰어들 때, 어떻게 시간을 두고 당신의 위치를 축적하는가, 그리고 당신의 돈을 꺼내기 시작할 필요가 있을 때 견디어야 하는 고통이다. 2000년 3월 또는 2008년 1월에 시작된 매수 및 보유 투자자는 그것이 2003년 3월 또는 2009년 3월에 시작된 사람만큼 훌륭한 시스템이라고 생각하지 않을 것이다. 더 좋은 방법이 없을까?
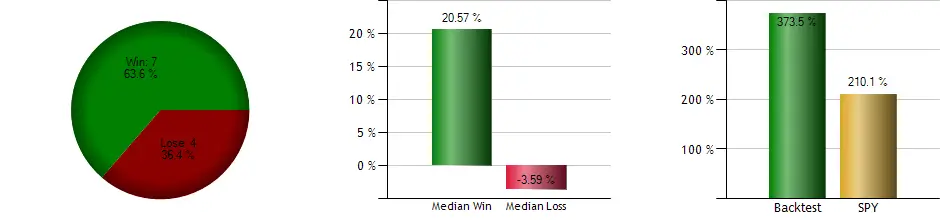
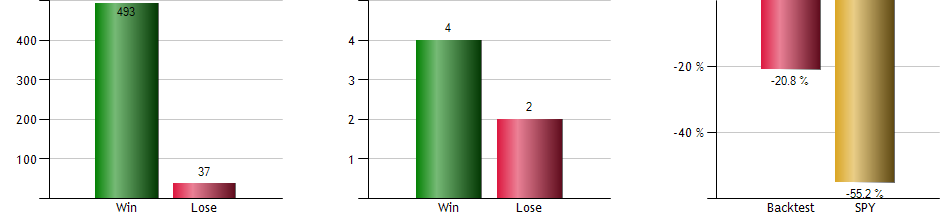
There is a simple moving average strategy that beat buy and hold investing over the past 20 years. It is not complicated, it is a type of trend following system and only takes one action on the last day of the month to execute it. It almost doubles the returns in the S&P 500 index and cuts the drawdown of capital almost to almost one third. Unlike mutual funds and hedge funds, a good systematic moving average strategy can beat the S&P 500 index over time by staying long during bull markets and going to cash during bear markets.
지난 20년 동안 매수와 보유를 능가하는 단순한 이동평균 전략이 있다. 그것은 복잡하지 않고, 그것은 일종의 유행 추종 시스템이고 그것을 실행하기 위해 달의 마지막 날에 한 가지 조치만 취한다. 그것은 S&P 500 지수에서 수익률이 거의 두 배나 되고 자본의 감소를 거의 3분의 1로 줄인다. 뮤추얼펀드나 헤지펀드와는 달리 좋은 체계적인 이동평균전략은 불시세에는 오래 머물며 약세시장에는 현금화함으로써 S&P 500지수를 시간이 지남에 따라 능가할 수 있다.
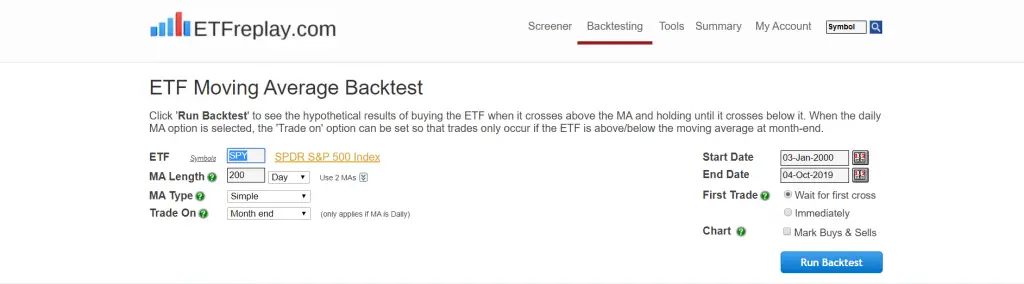
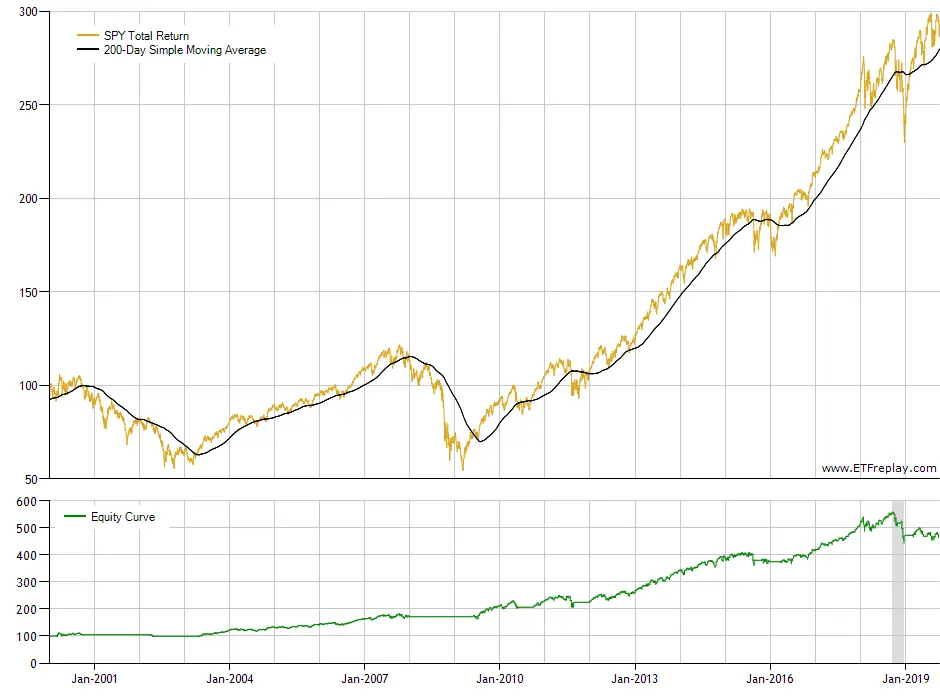
The 200 day simple moving average of prices is one of the most popular stock market signals and backtesting shows since the year 2000 it has worked best as an end of month signal. Below are the results if you simply bought the $SPY ETF and held if price ended the month over the 200 day simple moving average but sold and stayed in cash if the $SPY price was under the 200 day SMA on the last day of the month. This is not the Holy Grail of trend trading the SPY ETF, it is just math. The 2oo day SMA is lost during bear markets and crashes and price stays above the 200 day SMA during bull markets. The end of month signal avoids all the intra-month false signals when price chops(변화하다 ) under and over this line. For a swing of position trader the signals will seem like a long time frame but for a buy and hold investor this will seem like an active short term strategy.
The market timing of the trade signals of the below 11 trades does not get much better than this avoiding the two major bear markets of the past 20 years but capturing almost all the bull market profits.
200 일의 단순 이동 평균 가격은 2000 년 이후 가장 인기있는 주식 시장 신호 및 백 테스팅 쇼 중 하나이며 월말 신호로 가장 잘 작동했습니다. 아래는 $ SPY ETF를 단순히 구매하고 200 일 단순 이동 평균 이상으로 월이 종료되었지만 $ SPY 가격이 해당 월 말일 200 일 SMA 미만인 경우 매각되어 현금으로 유지 된 경우 보유한 결과입니다. . 이것은 SPY ETF를 거래하는 트렌드의 성배가 아니며 단지 수학입니다. 2oo 일 SMA는 하락 시장에서 잃어 버리고, 불 시장에서는 충돌하고 가격이 200 일 SMA를 초과하여 유지됩니다. 월말 신호는 가격이이 라인 이하로 줄어드는 월간 모든 잘못된 신호를 피합니다. 포지션 트레이더의 경우 신호는 장기적인 프레임처럼 보이지만 매수 및 매수 투자자에게는 활성 단기 전략처럼 보일 것입니다.
11 개 이하의 거래에서 거래 신호의 시장 타이밍은 지난 20 년간의 두 가지 주요 약세 시장을 피하면서 거의 모든 황소 시장 수익을 포착하는 것보다 훨씬 나아지지 않았습니다.
Here are four more $SPY moving average systems that beat buy and hold here.
Here are seven $QQQ moving average systems that beat buy and hold here.
.여기에 구매 및 보유를 능가하는 $ SPY 이동 평균 시스템이 4 개 더 있습니다.
여기에 구매 및 보유를 능가하는 7 개의 $ QQQ 이동 평균 시스템이 있습니다.
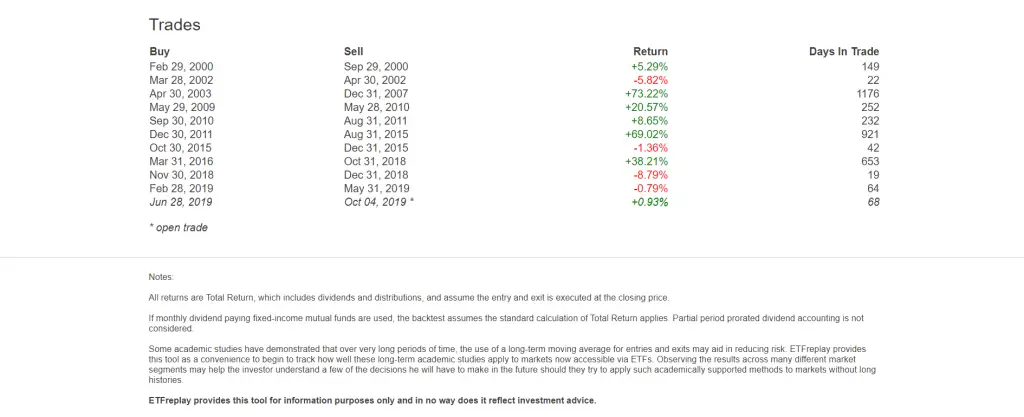
Backtest data courtesy of ETFreplay.com
백업 테스트 데이터( ETFreplay.com)제공
This post is not investment advice it is for informational purposes only.
이 게시물은 투자 조언이 아니다. 그것은 단지 정보 제공 목적일 뿐이다.