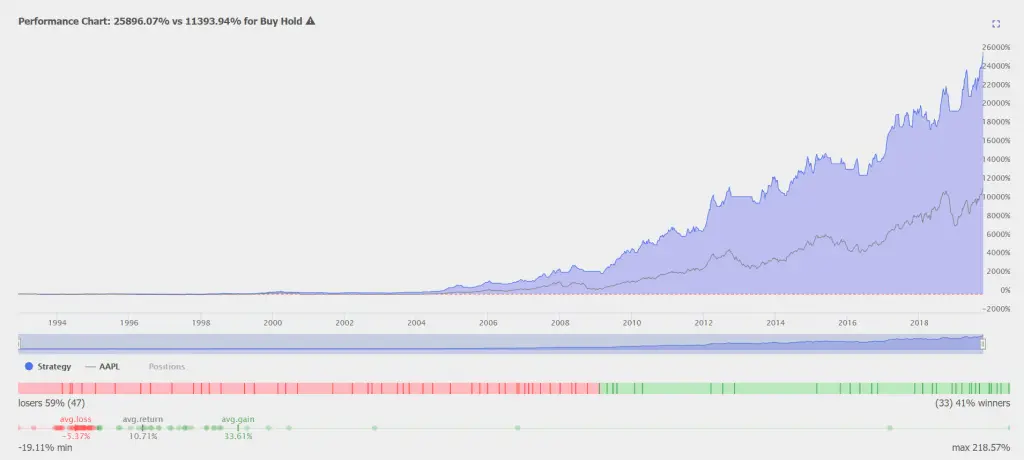
Apple is one of the top performing stocks of the past 27 years with a +11,393% return but what if I told you there was a trend trading signal that doubled those returns to +25,896%? Would you be interested? The power of moving average crossover signals is first in finding the right short and long moving averages that filter out enough volatility to not create too many false signals taking you in and out of trades too often creating multiple losses. The signal has to at the same time keep you in up trends for a long time and manage your exit to maximize profits. Your losses on false signals should also be minimized by getting you out early if the move reverses.
애플은 지난 27년 동안 수익률이 +11,393%로 가장 높은 주식 중 하나인데, 만약 내가 당신에게 그 수익률을 +25,896%로 두 배로 증가시키는 추세 거래 신호가 있다고 말한다면 어떨까? 관심 있으십니까? 이동 평균 교차 신호의 힘은 우선 너무 자주 거래에서 부터 들어오고 나가는 많은 거짓 신호를 생성하지 않도록 충분한 변동성을 걸러내는 적절한 짧고 긴 이동 평균을 찾는 것이 첫째이다. 신호는 당신을 오랫동안 상승 트렌드에 머물게 하는 동시에 이윤을 극대화시키기 위하여 당신의 출구를 관리하여야 한다 잘못된 신호에 대한 손실도 만약 그 움직임이 역전된다면 당신을 일찍 나감으로써 최소화되어야 한다.
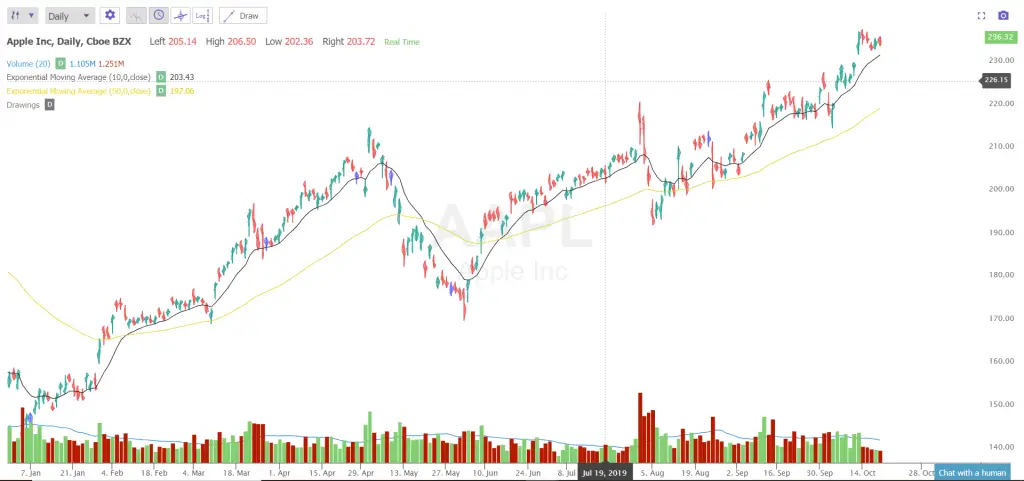
The following data is an example of a back test on historical data on the Apple stock chart using the 10 day / 50 day exponential moving average crossover signal as an end of day trend trading signal on the daily chart using the Trend Spider Strategy Tester.
다음 데이터는 Trend Spider Strategy Tester를 사용하는 일일 차트에서 추세거래신호 일의 마지막으로서 10일 / 50일 지수 이동 평균 교차 신호를 일일 차트를 사용하는 Apple 주식차트에 대한 과거 데이터를 백테스트하는 예이다
This trend trading strategy signals to go long when the 10 day EMA crosses and closes over the 50 day EMA and to go back to cash when the 10 day EMA crosses under and closes below the 50 day EMA. This is a simple way to introduce the principles of trend following in a systematic way to readers not familiar with the concept of trading price action.
이러한 경향 거래 전략은 EMA 10일이 50일 동안 교차 및 종료될 때 오래 지속되고, EMA 10일이 50일 미만일 때 현금으로 돌아간다. 이것은 거래 가격 행동의 개념에 익숙하지 않은 독자들에게 체계적인 방법으로 따르는 경향의 원리를 소개하는 간단한 방법이다.
This signal is a good trading tool for those who want to catch the longer trends and swings on the Apple chart. This signal is not only a good back test on the Apple chart of the past but is a good filter for trading any stocks in the future as it will have you go to cash if the 10 day is under the 50 day EMA and avoid the stocks that begin down trends and stay in downtrends as no entry signal will be given. It is also a good filter to keep you in winning stocks during bull markets and out of individual stocks during bear markets as all stocks eventually go down in market sell offs.
이 신호는 Apple 차트에서 더 긴 트렌드와 스윙을 잡으려는 사람들에게 좋은 거래 도구입니다. 이 신호는 과거 Apple 차트의 양호한 백 테스트 일뿐만 아니라 10 일이 50 일 EMA 미만인 경우 현금으로 이동하여 주식을 피할 수 있으므로 향후 주식 거래에 적합한 필터입니다. 진입 신호가 제공되지 않으므로 하락 추세를 시작하고 하락 추세를 유지합니다. 또한 모든 주식이 결국 시장 매도에서 하락함에 따라 상승 시장에서 주식을 이기고 곰 시장에서 개별 주식에서 벗어날 수있는 좋은 필터입니다.
Here is a book I have written with more examples of moving average signals that beat by and hold-> Click here.
여기에는 필적하고 유지하는 이동 평균 신호에 대한 더 많은 보기로 작성한 책입니다. 여기를 클릭하십시오.

All backtest data is courtesy of TrendSpider.com