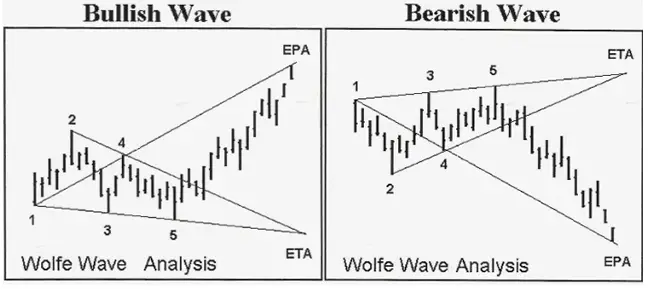
Wolfe Wave Patterns 울프 웨이브 패턴 By Steve Burns The Wolfe Wave chart pattern is created when price action makes 5 waves showing the key supply and demand areas that create a zone of support and resistance as buyers and sellers fight back and forth until a breakout of the expanding range occurs to a projected price extension. Wolfe Wave 차트 패턴은 가격 조치가 추정된 가격 확장에 대한 확장 범위로 돌파가 발생할 때까지 구매자와 판매자가 앞뒤로 싸울..


