Best and Worst Months for the Stock Market(주식시장에 가장 좋은 달과 최악의 달)
Have you ever been curious if certain months of the year have any statistically significant stock market returns better or worse on average than other months
일년 중 특정 월에 통계적으로 유의한 주식 시장의 수익률이 다른 달보다 평균적으로 더 좋거나 나쁜지 궁금해 본 적이 있는가?
Here are the statistics for monthly S&P 500 index performance from 1950 to 2019 to let you see if you see any patterns.
여기 1950년부터 2019년까지 월별 S&P 500 지수 실적 통계를 보면 패턴이 있는지 알 수 있다.
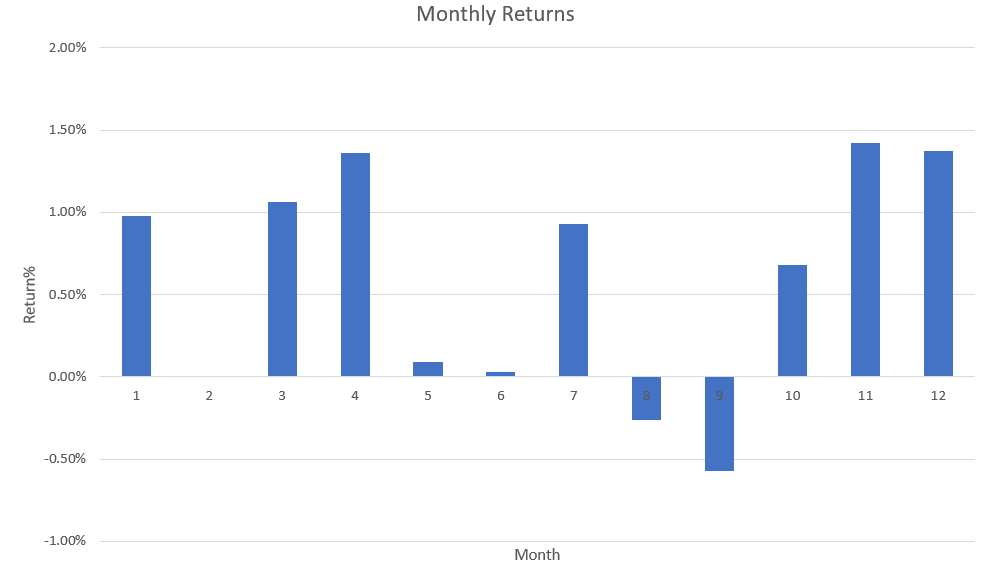
Month: Number of times with positive returns; number of times with negative returns = Average return.
월: 양수 수익을 가진 횟수, 음수 수익을 가진 횟수 = 평균 수익
January: 42 up years; 28 down years; average return = +0.98%
1월: 42년 상승, 28년 감소, 평균 수익 = +0.98%
February: 40 up years; 30 down years; average return = 0.00%
2월: 40년 증가, 30년 감소, 평균 수익 = 0.00%
March: 44 up years; 26 down years; average return = +1.06%
2월: 40년 증가, 30년 감소, 평균 수익 = 0.00%
April: 49 up years; 21 down years; average return = +1.36%
4월 : 49년 상승, 21년 감소, 평균 수익률 = +1.36%
May: 41 up years; 29 down years; average return = +0.09%
5월 : 41년 상승, 29년 감소, 평균 수익률 = +0.09%
June: 36 up years; 34 down years; average return = +0.03%
6월 : 36년 상승, 34년 감소, 평균 수익률 = +0.03%
July: 40 up years; 30 down years; average return = +0.93%
7월: 40년 증가, 30년 감소, 평균 수익 = +0.93%
August: 38 up years; 32 down years; average return = -0.26%
8월 : 38년 상승, 32년 감소, 평균 수익률 = -0.26%
September: 32 up years; 38 down years; average return = -0.57%
9월: 32년 상승, 38년 감소, 평균 수익 = -0.57%
October: 43 up years; 27 down years; average return = +0.68%
10월 : 43년 상승, 27년 감소, 평균 수익률 = +0.68%
November: 47 up years; 23 down years; average return = +1.42%
11월 : 47년 상승, 23년 감소, 평균 수익 = +1.42%
December: 52 up years; 18 down years; average return = +1.37%
12월: 52년 상승, 18년 감소, 평균 수익률 = +1.37%
The long term trend in the S&P 500 index is up but many months historical have zero returns over the past 70 years. Interesting that April, November, and December are statistically very bullish times while August and September are bearish on average for stocks. You can really see why there is the old saying: “Sell in May and go away.” and October through April is where the bulk of stock market returns come from historically.
S&P 500지수의 장기 추세는 상승하고 있지만 지난 70년 동안 많은 달의 과거 수익률은 0이다. 흥미롭게도 4월, 11월, 12월은 통계적으로 매우 강세인 반면 8월과 9월은 평균적으로 주식의 약세라는 것이다. 5월에 팔아서 가버리라는 옛말이 있는 이유를 알 수 있고, 10월에서 4월까지의 주식시장 수익의 대부분은 역사적으로 부터 오는 것이다.
'거래기술에 관한 정보' 카테고리의 다른 글
| Wolfe Wave Patterns(울프 웨이브 패턴) (0) | 2020.05.04 |
|---|---|
| How to Download Historical Stock Data(과거 주식 데이터를 다운로드하는 방법) (0) | 2020.05.03 |
| Things That a Backtest Does Not Show:(백테스트가 보여주지 않는 것들:) (0) | 2020.05.02 |
| Never Catch A Falling Knife(떨어지는 칼을 절대 잡지 마십시오) (0) | 2020.05.01 |
| The Cognitive Bias Codex(인식편향 항목) (0) | 2020.04.30 |