New Technical Indicator: Steve Burns Moving Averages Ribbon
(새로운 기술 지표: 스티브 번즈 이동 평균 리본)
Posted By: Steve Burnson:
The Steve Burns Ribbon technical indicator is a new tool for the technical analysis of stock trends by combining key moving averages. The MA Ribbon by Steve Burns is currently available on the TrendSpider.com charting platform and can be searched in indicators and loaded onto (장착하다)charts.
스티브 번즈 리본 기술 지표는 주요 이동 평균을 조합함으로써 주식 동향을 기술적으로 분석하는 새로운 도구다. 스티브 번즈의 MA 리본은 현재 TrendSpider.com 차트 작성 플랫폼에서 사용 가능하며 지표에서 검색되어 차트에 로드될 수 있다.
The moving averages in the Steve Burns Ribbon can be used as trend and swing trading tools in technical analysis. They quantify the direction and momentum of existing price moves on a chart. They can show trends and swings in price through their confluence(합류) of incline or decline in relation to price.
스티브 번즈 리본의 이동 평균은 기술 분석에서 트렌드 및 스윙 트레이딩 도구로 사용할 수 있다. 그들은 차트에서 기존 가격 이동의 방향과 모멘텀을 정량화한다. 그들은 가격과 관련하여 경사와 하락과의 겹치거나 통해 트렌드와 가격 변동을 보여줄 수 있다.
Moving averages filter for market sentiment in different time frames when price remains above one for multiple days. With the ribbon you can see the momentum and trend direction of price action by how many moving averages price is above on the chart.
이동 평균은 가격이 며칠 동안 1보다 높게 유지되는 경우 서로 다른 시간대의 시장 감정을 필터링합니다. 리본을 사용하면 차트에서 가격 이동 평균 수에 따라 가격 행동의 모멘텀과 추세 방향을 볼 수 있습니다.
My Ribbon is built from these moving averages.
내 리본은 이 이동 평균으로 만들어졌다.
5 day exponential moving average – Momentum
5일 지수 이동 평균 – 모멘텀
10 day exponential moving average – Short term trend
10일 지수 이동 평균 – 단기 추세
20 day exponential moving average – Reversion to the mean
20일 지수 이동 평균 – 평균으로 되돌림
30 day exponential moving average – Swing Filter
30일 지수 이동 평균 – 스윙 필터
50 day exponential moving average – Pullback in an uptrend
50일 지수 이동 평균 – 상승 추세의 후퇴
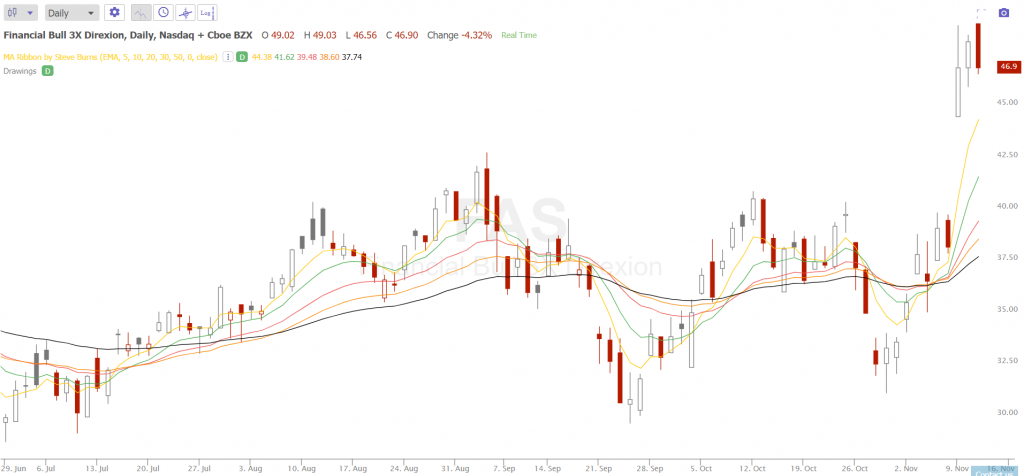
Chart courtesy of TrendSpider.com
Price becomes bullish in the timeframes of the moving averages it stays above.
The more moving averages price remains above the more bullish the chart is.
Here are exponential moving average crossover signals that can occur inside the Ribbon that can signal a bullish entry on a chart in a long term uptrend. When the short term moving average crosses and closes over the long term moving average that is the entry signal.
가격은 위에 머무르는 이동 평균의 시간대에 강세가됩니다.
더 많은 이동 평균 가격은 차트가 더 강세를 보일수록 위에 남아 있습니다.
다음은 지수이동평균 교차 신호인데 이는 장기 상승추세의 차트에서 강세진입을 신호나타낼 수 있는 리본의 내부에서 발생할 수 있다 . 단기 이동 평균이 교차하고 장기 이동평균의 위에서 멈출 때 그것은 진입 신호이다.
5 day / 20 day ema crossover: Flying Eagle (독수리)crossover
5 일 / 20 일 EMA 크로스 오버 : 플라잉 이글 크로스 오버
5 day / 30 day ema crossover: Flying Falcon(매) Crossover
5 일 / 30 일 EMA 크로스 오버 : Flying Falcon(매) Crossover
10 day / 30 day ema crossover: Flying Squirrel(다람쥐) Crossover
10 일 / 30 일 에마 크로스 오버 : 플라잉 다람쥐 크로스 오버
10 day / 50 day ema crossover: Flying Dragon(용) Crossover
10 일 / 50 일 EMA 크로스 오버 : 플라잉 드래곤 크로스 오버
The more crossover signals that a chart has at one time the more bullish it is.
차트가 한 번에 가졌던 교차신호가 많을 수록 더 많은 강세이다
If a trend starts running a profit target could be set near the 70 RSI zone.
추세가 실행되기 시작하면 운영이익 목표를 70 RSI 영역 근처에서 설정할 수 있습니다.
A stop loss should be placed after entry based on personal risk tolerance:
개인 위험 허용 범위를 기준으로 진입 후 손절매를 설정해야합니다.
1.A stop loss could be placed on a percentage drop of price.
정지 손실을 가격의 하락 비율에 놓일 수 있다
2..A stop loss could be set if price falls below the short term moving average in the crossover
정지손실은 가격이 단기 이동 평균 이하로 떨어지면 설정될 수 있다.
3.A stop loss could be set if price falls below both moving averages used in the crossover.
정지손실은 가격이 크로스 오버에 사용 된 두 이동 평균 아래로 떨어지면 설정 될 수 있습니다.
A trailing stop should be used on winning trades based on open profit risk parameters.
후행정지는 개방형 수익 위험 매개변수에 따르는 승리거래에 사용되어져야 한다.
1.For swing traders a trailing stop could be set at a loss of the short term moving average.
스윙 트레이더에게는 후행중지는 단기 이동평균 손실 시 설정할 수 있다.
2.For momentum traders a trailing stop could be a loss of the previous day’s low.
모멘텀 트레이더에게는 후행 중지는 전날의 최저치의 손실일 수 있다.
3.For a trend trader a winner could be held under the short term moving average crosses back under the longer term moving average.
트렌드 트레이더의 경우, 우승자는 보다 장기 이동평균 아래에서 교차하는 단기 이동평균 아래에서 유지될 수 있다
These signals are built for charts in long term uptrends or tend to swing from highs to lows in price like stock index ETFs, market leaders, and leading growth stocks. These are not meant for markets that historically trade sideways or down in price. Also highly volatile charts tend to create too many false signals.
이러한 신호는 장기 상승 추세의 차트를 위해 구축되거나 주가 지수 ETF, 시장 리더 및 주요 성장 주식과 같은 가격의 고점에서 저가로 변동하는 경향이 있습니다. 이는 역사적으로 가격이 횡보 또는 하락하는 시장을 위한 것이 아닙니다. 또한 변동성이 높은 차트는 너무 많은 잘못된 신호를 생성하는 경향이 있습니다.
For a higher probability of success with signals they should all be backtested on your watchlist before using them in live trading. These backtests can all be performed on the TrendSpider.com backtesting platform. While all backtests may not beat buy and hold on a chart most will have better risk adjusted returns by having lower drawdowns.
신호로 성공할 가능성이 더 높으려면 실시간 트레이딩에 사용하기 전에 감시 목록에서 그들은 모든 것을 백 테스트해야 한다. 이러한 백테스트는 모두 TrendSpider.com 백테스팅 플랫폼에서 수행될 수 있다. 모든 백테스트가 차트에서 매수 및 보유를 이기지 못할 수 있지만, 대부분의 테스트는 더 낮은 하락을 가짐으로서 보다 나은 위험 조정수익을 얻을 수 있다
The crossover signals can create positive expectancy models for trading by creating small losses and big wins based on the trade management using stop losses and trailing stops, that is where the real edge comes from in trading.
크로스오버 신호는 트레이딩에서 실제 우위가 나오는 스톱손실과 후행스톱을 이용한 트레이드 관리를 바탕으로 작은 손실과 큰승리를 창출함으로서 거래에 긍정적인 기대 모델을 만들 수 있다.

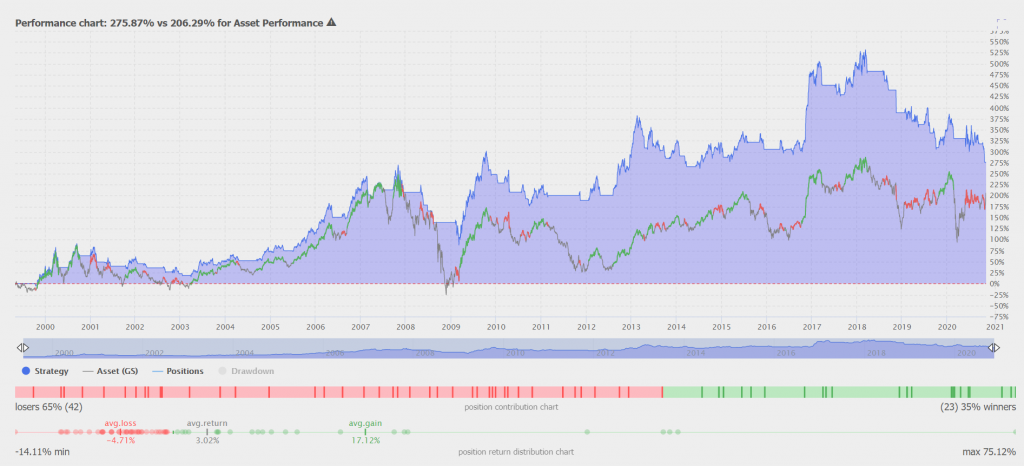
Backtest data courtesy of TrendSpider.com
Here are moving average cross unders that can signal a bearish entry on a chart in a long term downtrend. These can be used to go to cash, or signals for short selling based on the long term chart trend.
장기 하락 추세에서 차트에 약세 진입을 알릴 수있는 아래에서 이동 평균 교차입니다. 이들은 현금으로 이동하거나 장기 차트 추세에 따라 공매도 신호를 보내는 데 사용할 수 있습니다.
5 day / 20 day ema cross under: Lame Duck cross under
5 일 / 20 일 에마 크로스 언더 : Lame Duck(빚을 갚지 못해 제명된 거래원) cross under
10 day / 50 day ema cross under: Loch Ness Monster cross under.
10 일 / 50 일 에마 크로스 언더 : 네스호 몬스터 크로스 언더.
The biggest enemy of moving averages is high volatility. Crossover signals help filter out most of the noise of volatility and show the trend.
이동 평균의 가장 큰 적은 높은 변동성이다. 교차 신호는 변동성의 잡음을 대부분 걸러내고 추세를 보여주는 데 도움이 된다.
The new technical indicator the MA Ribbon by Steve Burns is available now on the TrendSpider.com charting and backtesting platform and can be a new trend filtering tool to add to your own technical analysis.
Steve Burns의 새로운 기술 지표인 MA 리본은 현재 TrendSpider.com 차트 작성 및 역테스트 플랫폼에서 이용할 수 있으며, 자신의 기술 분석에 추가할 수 있는 새로운 트렌드 필터링 툴이 될 수 있다.
'거래기술에 관한 정보' 카테고리의 다른 글
| Best Day Trading Books(베스트 데이 거래책) (0) | 2020.11.13 |
|---|---|
| Lessons From the Best Trader of All Time: Jim Simons:(역대 최고의 트레이더로부터 받은 교훈: 짐 시몬스:) (0) | 2020.11.12 |
| Trading Books with Backtesting Results(트레이더들이 손실로부터 회복하는 방법:) (0) | 2020.11.11 |
| How Traders Rebound From Losses:(트레이더들이 손실로부터 회복하는 방법) (0) | 2020.11.11 |
| Perma-Arguments(페르마의 주장) (0) | 2020.11.10 |